Figures & data
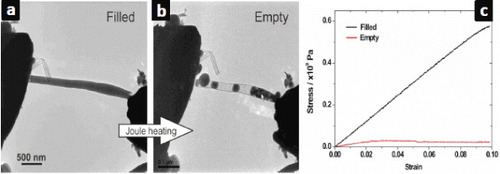
Figure 1 (a) Overview and (b) high-magnification TEM images of the Fe-filled CNTs. (c) Magnetization versus magnetic field strength at 5 K. Arrows indicate the direction of the field sweep. (Reproduced with permission from [Citation30] © 2010 IOP Publishing Ltd.)
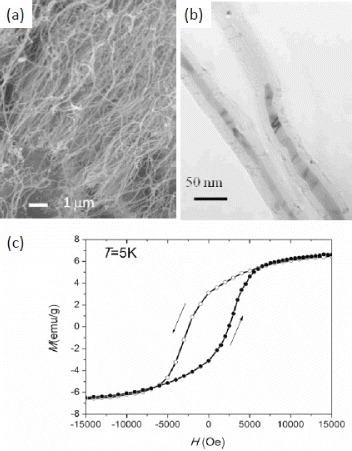
Figure 2 (a) Overall view of a cobalt pentlandite filled MWCNT. (b) Detail of the region boxed in (a). (c) Model of a CNT filled with cobalt pentlandite. (d) TEM image simulation based on the model in (c). (Reproduced with permission from [Citation37] © 2003 RSC Publishing.)
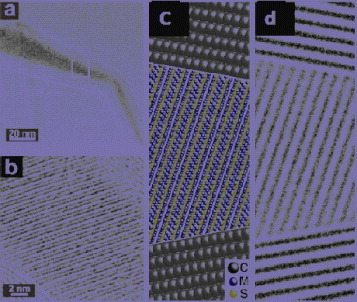
Figure 3 (a) TEM images of encapsulated DWCNTs. (b, c) Typical HRTEM images of DWCNTs including long molybdenum chains. (d) Typical Raman spectra acquired from the sample under 633 nm excitation. (Reproduced with permission from [Citation42] © 2008 American Chemical Society.)
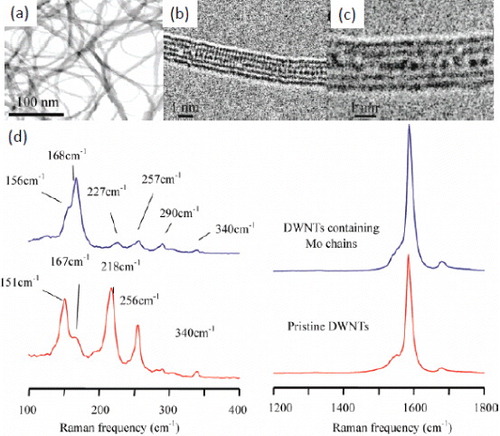
Figure 4 (a) MWCNT filled with an amorphous 1:1 mixture of KCl/UCl4. (b) MWCNT filled with a long crystalline wire of eutectic KCl/UCl4 mixture. (c) Table showing some of the attempted compositions and obtained products. (Reproduced with permission from [Citation43] © 1998 Elsevier B.V.)
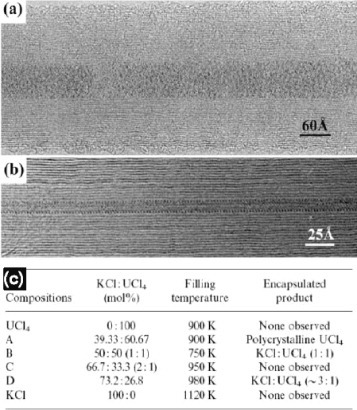
Figure 5 (a–c) TEM images of an SWCNT filled with AgCl1-xIx. (d–f) Model of the encapsulated structure. (g) Electron energy-loss spectrum of alloy-filled CNTs. (Reproduced with permission from [Citation44] © 2008 American Chemical Society.)
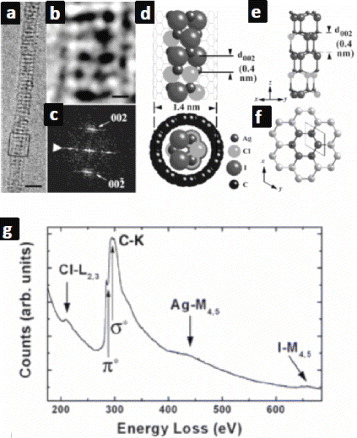
Figure 6 (a–c) Various examples of MWCNTs filled with CoFe2O4. The arrows in (a) point to solid caps that impair the filling progression. (Reproduced with permission from [Citation47] © 2004 Elsevier B.V.)
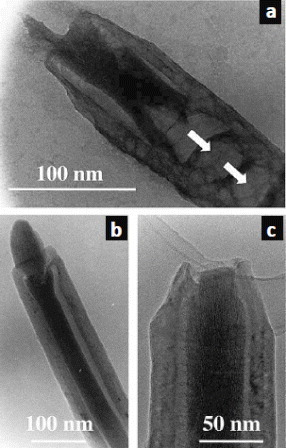
Figure 7 (a) SEM and (b) TEM images of ultrafine InP nanowires sheathed by CNTs. (c) Electron diffraction pattern along the [001] zone axis. HRTEM image of (d) the nanocable, (e) the carbon layers and (f) energy-dispersive spectrum (EDS) of the nanocable. (Reproduced with permission from [Citation49] © 2004 AIP.)
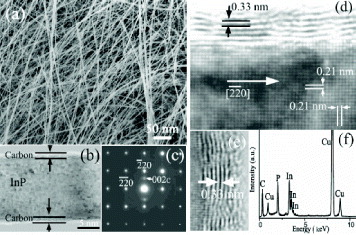
Figure 8 (a) Open end of a Zn0.92Ga0.08S@MWCNT. (b) Detail of the carbon shell and crystalline core [Citation51].
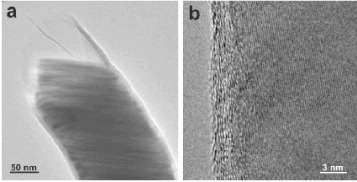
Table 1 Various types of inorganically filled CNTs. AAO stands for anodized aluminum oxide.
Figure 9 Temperature dependence of (a) NMR frequency and (b) nuclear spin lattice relaxation rate of 127I from CuI@CNT. The symbols represent experimental data and the solid lines are a fit. (Reproduced with permission from [Citation68] © 2008 Future Medicine Ltd.)
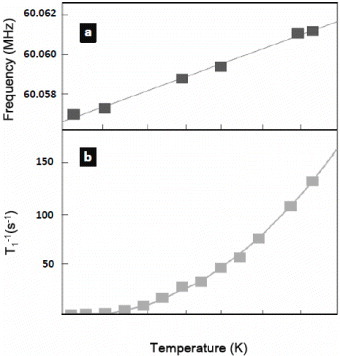
Figure 10 (a, b) Partial release of the core Ga-doped ZnS from the interior of a turbostratic CNT. (c) The stress-strain plot demonstrates the dominant effect of the filling on the mechanical characteristics of the composite [71].