Figures & data
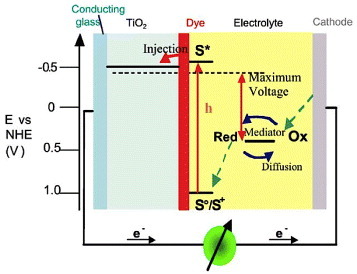
Figure 1 Crystal structures of zinc stannate: perovskite structure for zinc metastannate (ZnSnO3) and cubic spinel structure for zinc orthostannate (Zn2SnO4). A single atom of each element is labeled in the structural diagrams.
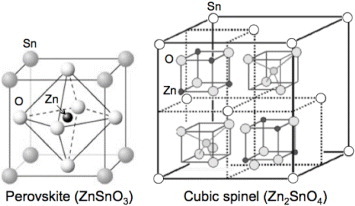
Figure 2 SEM images of zinc hydroxystannate (ZHS) microcubes (a) lower magnification, (b) higher magnification, (c) schematics of the growth process. (Reproduced with permission from [Citation25] © 2007 Elsevier B.V.)
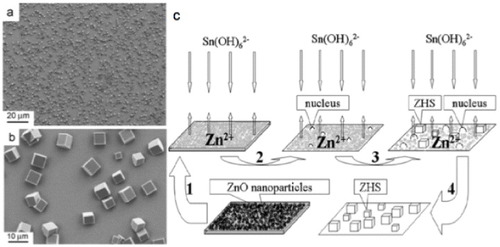
Figure 3 The ZnSnO3 nanoparticles reported by Xu et al: (a) scanning electron image, (b) transmission electron image where the hexagonal shape can be clearly seen. (Reproduced with permission from [Citation62] © 2006 Elsevier B.V.)
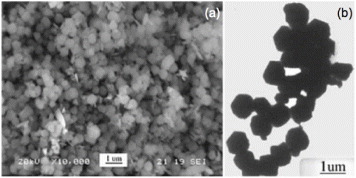
Figure 4 TEM images of Zn2SnO4 nanoparticles prepared using Zn(CH3COO)2 2H2O and SnCl4 5H2O with NaOH as mineralizer at (a) 220 °C (Reproduced with permission from [Citation47] © 2001 Elsevier B.V.), (b) 200 °C (Reproduced with permission from [Citation23] © 2006 Elsevier B.V.), (c) SEM image of Zn2SnO4 nanoparticles prepared at 170 °C with tert-butylamine as the coordinating agent. (Reproduced with permission from [Citation44] © 2009 American Chemical Society.)
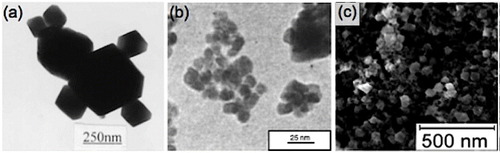
Figure 5 Schematics of the formation of ZTO nanocrystals through a crystallization–dissolution–recrystallization process. (Reproduced with permission from [Citation53] © 2008 American Chemical Society.)
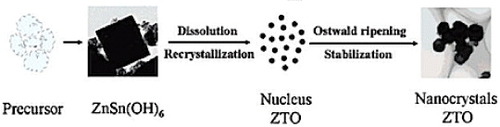
Figure 6 Different phases obtained during the formation of ZTO as functions of reaction temperature and NaOH concentration. (Reproduced with permission from [Citation47] © 2001 Elsevier B.V.)
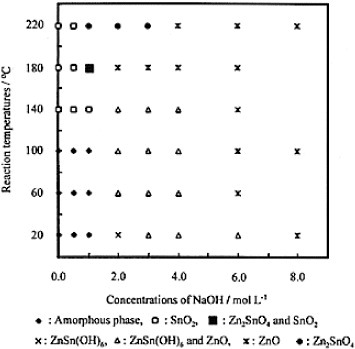
Figure 7 TEM images of Zn2SnO4 (a,b) and ZnSnO3 (c) with corresponding electron diffraction patterns (d)–(f). Panels (g) and (h) outline the crystal shapes of Zn2SnO4 and ZnSnO3, respectively. ([Citation14]—Reproduced by permission of The Royal Society of Chemistry.)
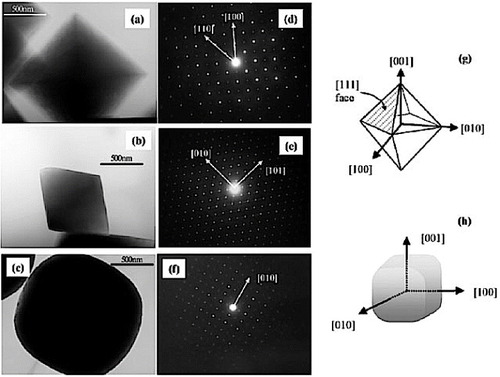
Figure 8 (a)Low-magnification TEM image and SAED pattern of ZTO nanorods. (b,c) High-magnification TEM images of ZTO nanorods. (d) TEM image and SAED pattern of ZTO crystals synthesized using NaOH. (Reproduced with permission from [Citation48] © 2006 American Chemical Society.)
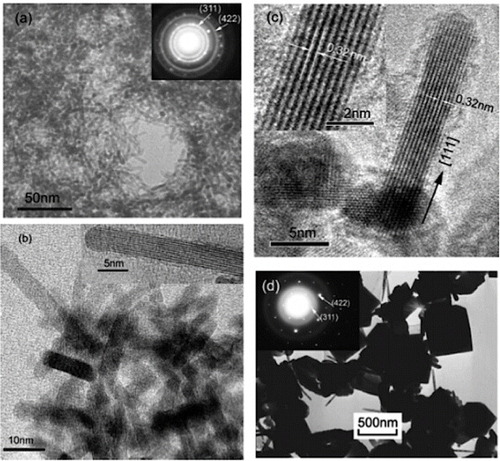
Figure 9 SEM images of the ZTO microstructures: (a) low magnification image of the Zn2SnO4 octahedrons, (b) ZnSn(OH)6 cubes formed in the initial stage of the reaction. Note secondary nucleation on the cube surfaces, (c) a Zn2SnO4 octahedron, (d) coalescing nanoplates. (Reproduced with permission from [Citation70] © 2010 Elsevier B.V.)
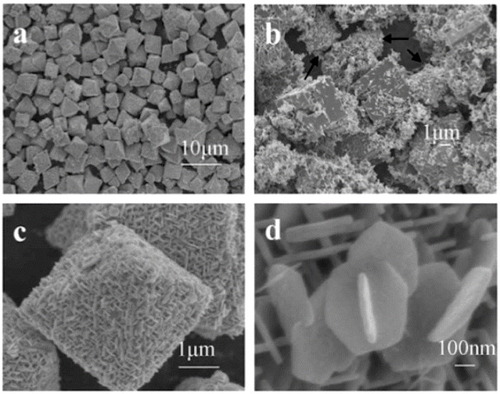
Figure 10 TEM images of the Zn2SnO4 nanoparticles synthesized under the optimized conditions of 200 °C, 24 h and a molar ratio of Zn:Sn:Na2CO3=2:1:4. Insets present SAED patterns. The dotted area in panel (c) is magnified in panel (d). (Reproduced with permission from [Citation71] © 2010 Elsevier B.V.)
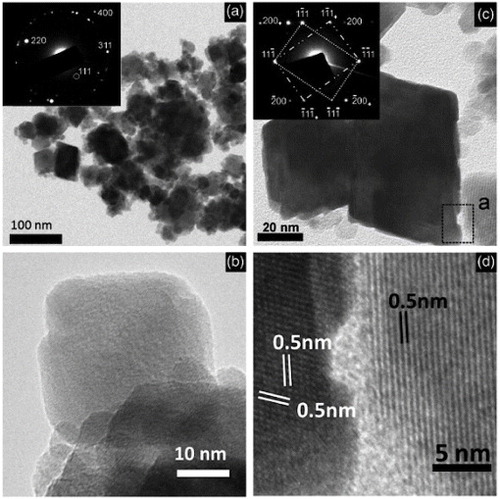
Figure 11 XRD patterns of (a) ZnSnO3 nanoparticles(Reproduced with permission from [Citation62] © 2006 Elsevier Ltd.). (b) Zn2SnO4 nanoparticles prepared using Na2CO3 as the mineralizer (Reproduced with permission from [Citation71] © 2010 Elsevier B.V.). (c) Zn2SnO4 octahedrons after (a) 2 h, (b) 4 h, (c) 6 h and (d) 20 h of synthesis (Reproduced with permission from [Citation73] © 2002 American Institute of Physics). The peaks of ZnSn(OH)6 and Zn2SnO4 are indexed. (d) XRD pattern of the hydrothermally grown Zn2SnO4 nanorods. (Reproduced with permission from [Citation48] © 2006 American Chemical Society.)
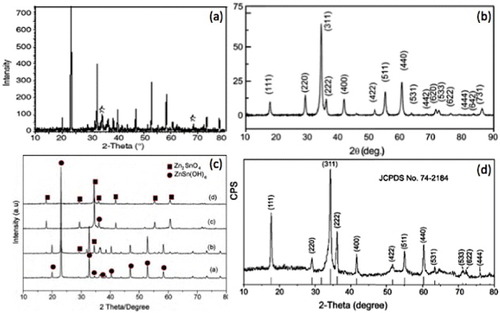
Figure 12 Optical absorption spectra of (a) Zn2SnO4 nanoparticles: (•) as is and (o) after annealing at 500 °C for 30 min (Reproduced with permission from [Citation44] © 2009 American Chemical Society). (b) ZTO hydrothermally synthesized at 200 °C for 20 h (sample A: citrate as the additive agent; sample B: no additives; sample C: CTAB as the additive surfactant). (Reproduced with permission from [Citation53] © 2008 American Chemical Society.)
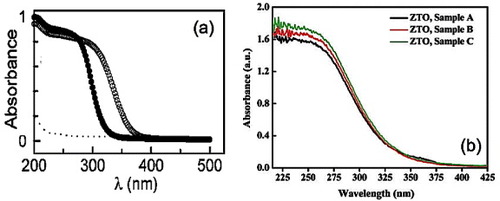
Figure 13 Photoluminescence spectra (280 nm excitation) of hydrothermally synthesized Zn2SnO4 nanoparticles using (a) n-butylamine (Reproduced with permission from [Citation21] © 2009 Elsevier B.V.), (b) hydrazine hydrate (Reproduced with permission from [Citation78] © 2009 Elsevier B.V.) as the mineralizer.
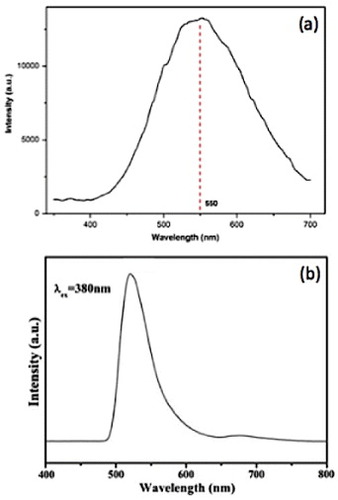
Figure 14 (αhv)2 versus hv curves of Zn2SnO4 nanocrystals (a) synthesized using NaOH as the reducing agent with different additives (Sample A: citrate as additive, Sample B: no additives and Sample C: CTAB as the additive) (Reproduced with permission from [Citation53] © 2008 American Chemical Society.), (b) synthesized using n-butylamine as the reducing agent. (Reproduced with permission from [Citation21] © 2009 Elsevier B.V.)
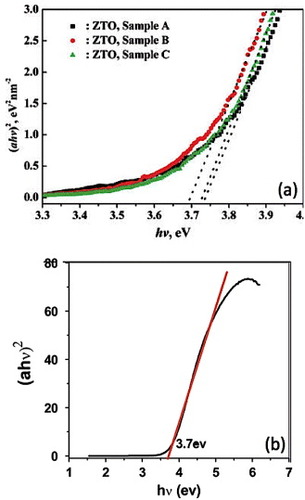
Figure 15 Calculation of bandgap energy for direct-forbidden transition from the x-intercept of the as-prepared nanoparticulate film (•) (Eg=3.71±0.04 eV) and the heat-treated film (∘) (Eg=3.25±0.03 eV). (Reproduced with permission from [Citation44] © 2009 American Chemical Society.)
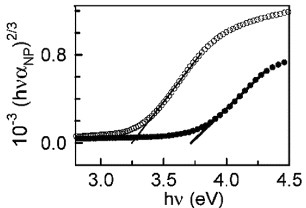
Figure 16 (a) Photocurrent (iph) action spectrum of Zn2SnO4 after heat treatment (O). The x intercept of the rising part (321 nm) yields Eg=3.86 eV (extrapolation error ± 0.08 eV). For comparison, the optical absorbance of a film before heat treatment is also included. (b) Photocurrent as a function of potential at pH 4.8 (1 M KCl and 1 M AcO–) ν=1 mV s−1, 200 W Hg lamp, 0.05 Hz chopping frequency. (b) Flat band potential (Efb) for Zn2SnO4 nanoparticulate films. (Reproduced with permission from [Citation44] © 2009 American Chemical Society.)
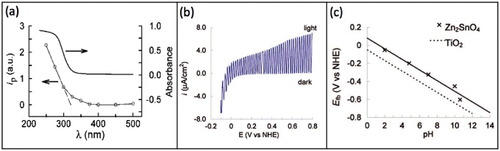
Figure 17 Comparative energy band diagrams of Zn2SnO4 (Eg=3.7 eV) and TiO2 (Eg=3.2 eV) in aqueous solution at pH 4.8; for simplicity, the surface states in TiO2 near the conduction band (CB) are not shown. CB is drawn assuming EF=Efb≈Ecb. (Reproduced with permission from [Citation44] © 2009 American Chemical Society.)
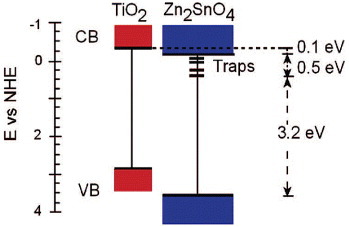
Figure 18 (a) TEM image of Zn2SnO4 nanoparticles used for degrading methyl orange dye. (b) Optical absorption spectra showing the dye degradation. Inset: repeatability test. (Reproduced with permission from [Citation21] © 2009 Elsevier B.V.)
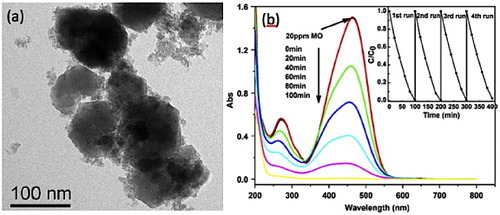
Figure 19 Basic operating principle of metal oxide semiconductor gas sensor (a) in ambient air, (b) in presence of reducing gas (increase in conductance), (c) in presence of oxidizing gas (decrease in conductance).
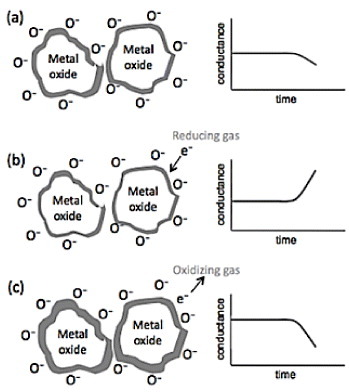
Figure 20 (a) Sensitivities of ZnSnO3-based gas sensor to different gases. (Reproduced with permission from [Citation62] © 2006 Elsevier Ltd.) (b) Response cycling curve of the sensor elements prepared from the nanostructured (a1) and bulk (a2) materials when the surrounding gas was switched between air and 200 ppm ethanol-saturating air. The working temperature was kept at 250 °C (relative humidity: 40%). (Reproduced with permission from [Citation114] © 2005 Elsevier B.V.)
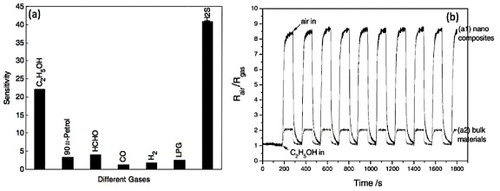
Figure 21 (a) Scanning electron image of cage-like ZnSnO3 nanostructures, (b,c) response transients of the ZnSnO3 sensor to different concentrations of ethanol (b) and formaldehyde (c). (Reproduced with permission from [Citation65] © 2009 Elsevier B.V.)
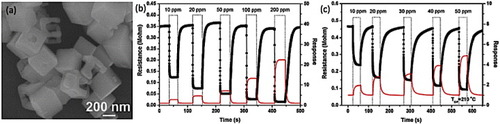
Figure 22 Principle of operation and energy level scheme of the dye-sensitized nanocrystalline solar cell. Photoexcitation of the sensitizer (S) is followed by electron injection into the conduction band of an oxide semiconductor film. The dye molecule is regenerated by the redox system, which itself is regenerated at the counter-electrode by electrons that passed through the load. Potentials are referred to the normal hydrogen electrode (NHE). The open circuit voltage of the solar cell corresponds to the difference between the redox potential of the mediator and the Fermi level of the nanocrystalline film indicated with a dashed line. The energy levels drawn for the sensitizer and the redox mediator match the redox potentials of the doubly deprotonated N3 sensitizer ground state and the iodide/triiodide couple. (Reproduced with permission from [Citation116] © 2004 Elsevier B.V.)