Figures & data
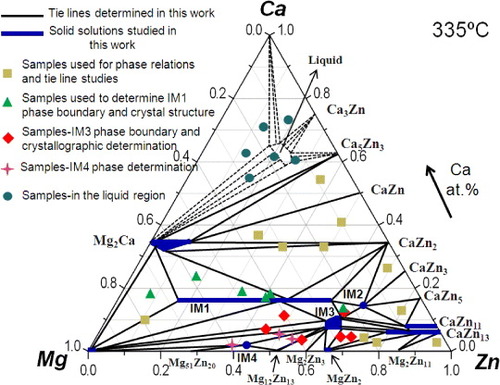
Figure 1 Isothermal section of the Ca–Mg–Zn system at 335 °C, redrawn from the database of Wasiur-Rahman and Medraj [Citation17], including comparison of the ternary compounds reported in [Citation7–14].
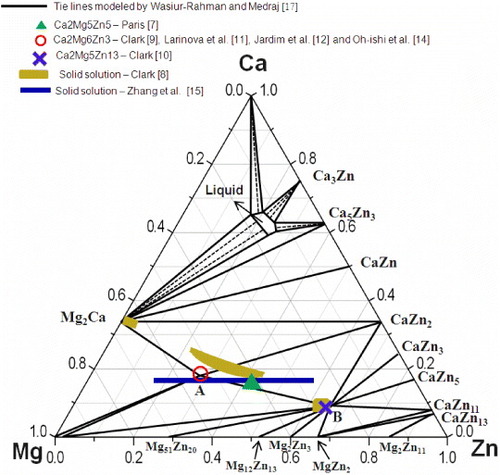
Figure 2 Terminal compositions of the diffusion couples superimposed on the calculated isothermal section of the Ca–Mg–Zn system at 335 °C based on [Citation17]: (a) six solid–solid diffusion couples; (b) three solid–liquid diffusion couples.
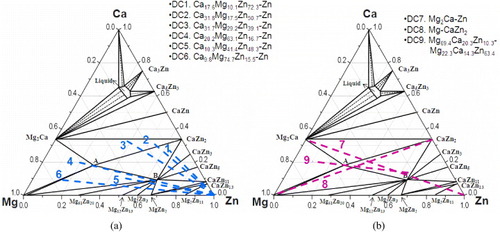
Figure 3 (a, b) BSE images of the solid–solid DC1 annealed at 335 °C for 4 weeks, showing the formation of seven intermetallic compounds and the tooth like morphology; (c) composition profile along the line scan shown in (a).
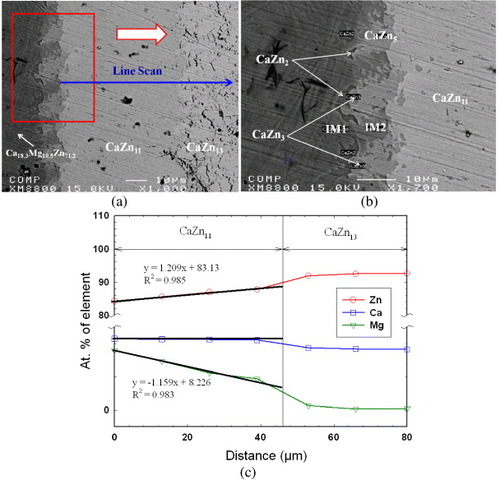
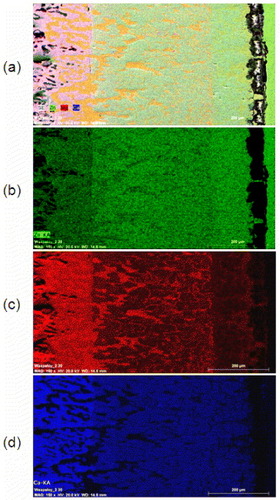
Figure 4 (a) BSE images of the solid–solid DC5 annealed at 335 °C for 4 weeks showing the formation of five intermetallic compounds; (b) EBSD patterns of (I) IM1 and (II) IM3 ternary compounds and (III) CaZn13 binary compound having extended solid solubility into ternary system. The right panels are indexed copies of the left EBSD patterns.
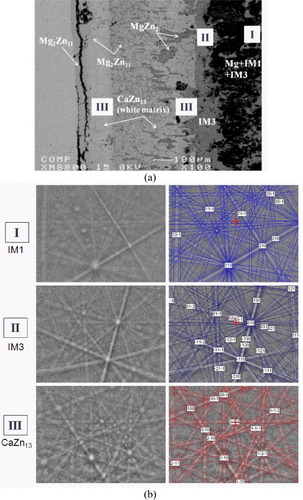
Figure 5 SEM/EDS maps of the solid–solid DC5. The intensity of green, red and blue colors reflects the atomic concentrations of Zn, Mg and Ca, respectively.
Crystallographic information of the phases in the Ca–Mg–Zn system [Citation25].
Figure 6 (a) BSE image of the solid–liquid DC7 annealed at 335 °C for 4 weeks showing the formation of three intermetallic compounds; (b) composition analysis along the line scan shown in (a); (c) partial isothermal section of the Mg–Zn–Ca system obtained from nine diffusion couples annealed at 335 °C for 4 weeks. It summarizes the actual compositions of the key samples used to study the solubility ranges, phase relations and crystal structures of various compounds in the Ca–Mg–Zn system.
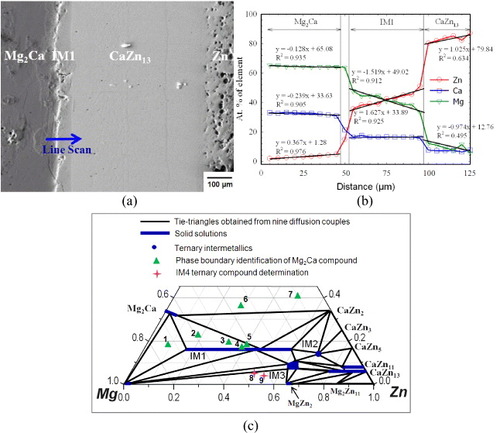
Figure 7 Simplified schematic illustration of the morphological characteristics observed in different diffusion couples: (a) tooth like and (b) finger like; (c) possible morphologies in solid–solid diffusion couples when a pure element is attached to a three-phase alloy.
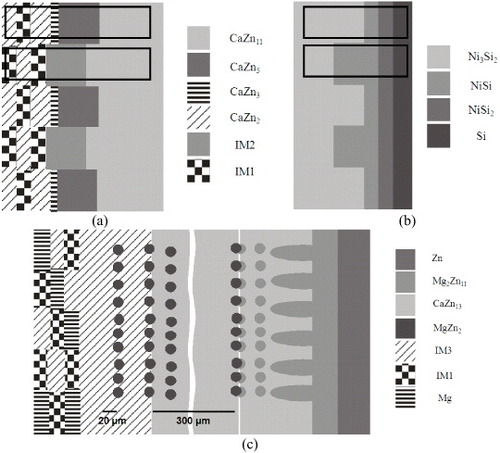
Figure 8 Sample 7 annealed at 335 °C for 4 weeks: (a) SEM BSE image; (b) Rietveld analysis.
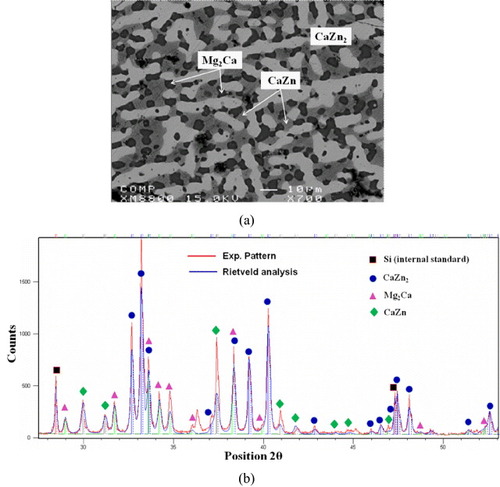
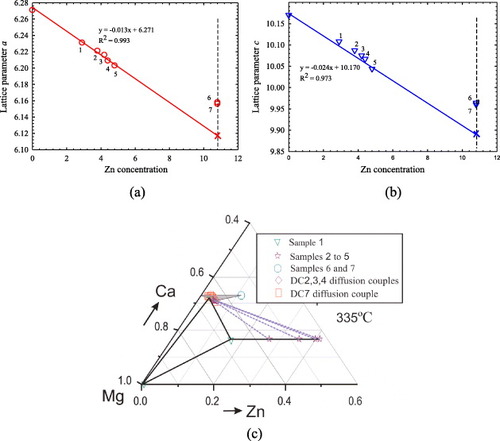
Figure 9 Variation of unit cell parameters (a) a and (b) c with Zn concentration in the Mg2Ca compound. Substitution of Ca and Mg by Zn decreases both a and c. (c) Phase boundaries of Mg2Ca and the phase relations among Mg2Ca, IM1 and Mg solid solutions.
Chemical compositions of the key samples and the phases present.
The chemical compositions and unit cell parameters of Mg2Ca determined by EPMA and Rietveld analysis.
Figure 10 (a) BSE image of sample 8; (b) BSE image of sample 9; (c) Rietveld analysis for sample 8.
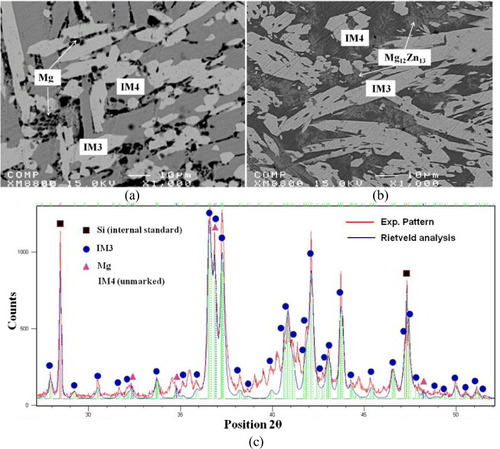
Figure 11 Isothermal section phase diagram of Mg–Zn–Ca system constructed from nine diffusion couples and 32 key samples annealed at 335 °C.