Figures & data
Scheme 1 Preparation of a multilayer of SAM modified bare and Pd modified GNCs on Au and ITO electrodes. (a) PAH modification, (b) formation of the monolayer of SAM modified GNCs, (c) formation of the multilayer of SAM modified GNCs, (d) removal of the SAMs from the GNCs and (e) adsorption of Pd on the GNCs.
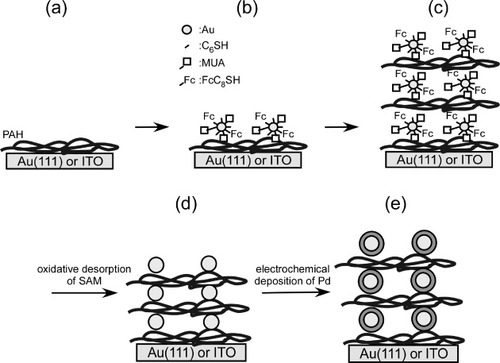
Figure 1 (a) Cyclic voltammograms of the 5-layer GNC electrode on the Au(111) electrode measured in an Ar saturated 0.1 M HClO4 solution at a scan rate of 50 mV s−1: (—) 0, (− −) 5, (····) 10, (−··−) 20, (−·−) 30 cycles between 0 and 1300 mV were applied to desorb SAM. (b) Cyclic voltammograms of oxidative desorption of SAM from 5 layers of the GNC electrode on the Au(111) electrode measured in an Ar saturated 0.1 M HClO4 solution at a sweep rate of 50 mV s−1, repeating the potential cycle between 0 and 1300 mV for 5 (− −), 10 (····), 20 (−··−), and 30 (−·−) times to desorb SAM.
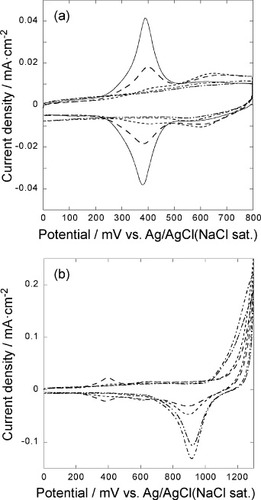
Figure 2 FE-SEM images of (a) ITO, (b) ITO coated with PAH, 5 layers of PAH/GNCs on ITO substrates after (c) 0, (d) 1, (e) 2, (f) 3, (g) 4, and (h) 14 oxidative desorption cycles in a 0.1 M HClO4 solution applied at a scan rate of 50 mV s−1.
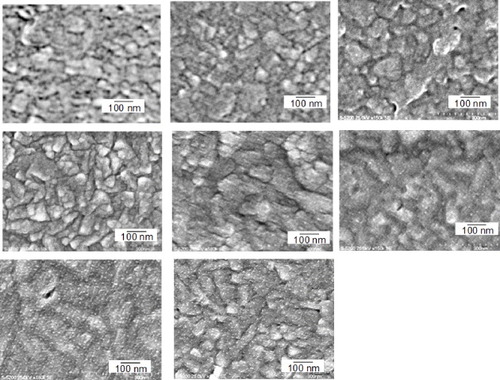
Figure 3 Cyclic voltammogram of the 5-layer Pd modified GNC electrode in a 0.1 M H2SO4 solution measured at a scan rate of 50 mV s−1.
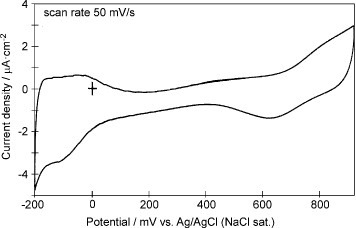
Figure 4 Rotation rate dependent polarization curves of the 5-layer GNC electrode after 35 oxidative desorption cycles (a) before and (b) after Pd deposition. The curves were measured in an oxygen saturated 0.1 M KOH solution at a scan rate of 10 mV s−1.
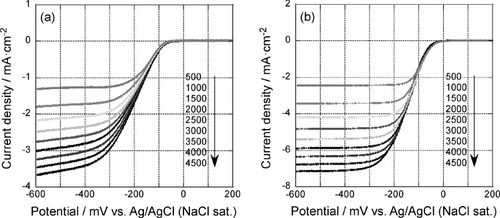
Figure 5 Levich plots for the GNC multilayer electrode at −600 mV before (▪) and after () Pd deposition (figure ). Solid lines are fit for 2-electron and 4-electron processes.
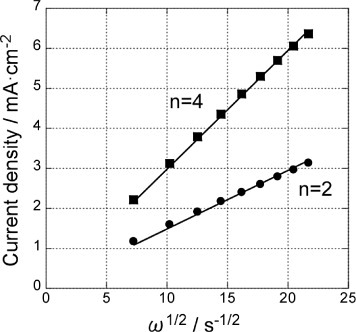
Figure 6 Koutecky–Levich plots for the polarization curves (figure ) of the 5-layer GNC electrode (a) before and (b) after Pd deposition.
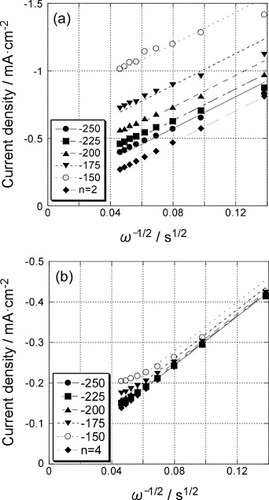
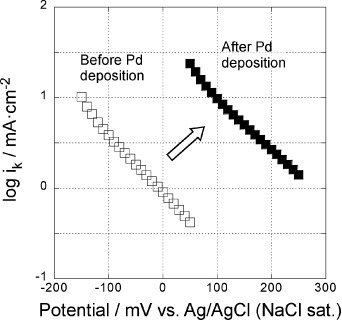
Figure 7 Potential dependence of reaction rate constants of the 5-layer GNC electrode, measured in a 0.1 M KOH solution before (open symbols) and after Pd deposition (solid symbols).
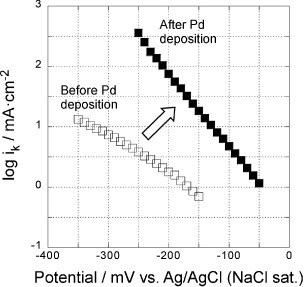
Figure 8 Rotation rate dependent polarization curves of the 5-layer GNC electrode measured after 35 oxidative desorption cycles in an oxygen saturated 0.1 M H2SO4 solution at a scan rate of 10 mV s−1, (a) before and (b) after Pd deposition.
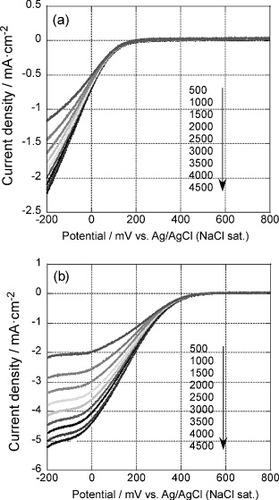
Figure 9 Levich plot for the GNC multilayer electrode at −100 mV after Pd deposition (figure (b)). Solid line is a fit by a 4-electron process.
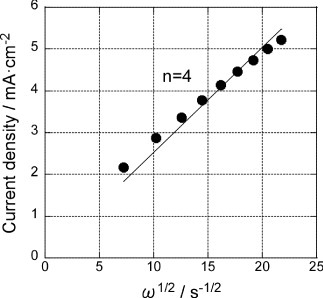
Figure 10 Koutecky–Levich plots for the polarization curves (figure ) of the 5-layer GNC electrode (a) before and (b) after Pd deposition.
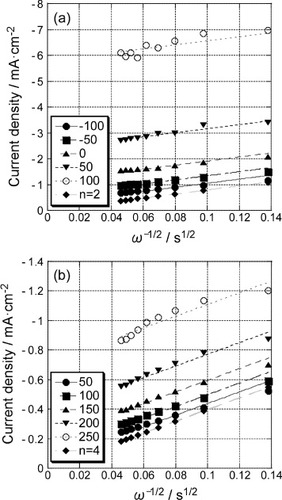
Figure 11 Potential dependence of reaction rate constants of the 5-layer GNC electrode measured in a 0.1 M H2SO4 solution before (open symbols) and after (solid symbols) Pd deposition.