Figures & data
Figure 1 Chemical structures of compounds used in this work. Phase transitions and corresponding temperatures are given at the bottom of panel (a).
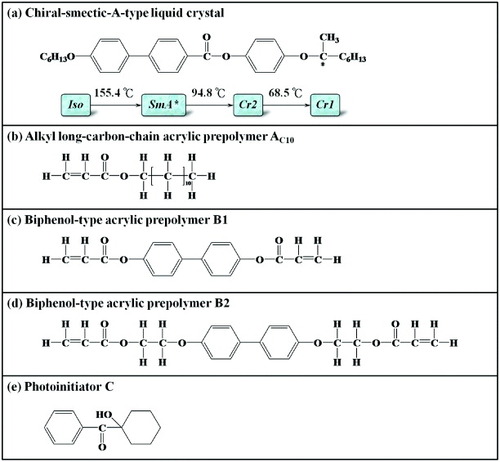
Compositions of LC mixtures.
Figure 2 Schematics of multicomponent LC mixture cells after UV irradiation, showing formation of double VACOF layers due to phase separation.
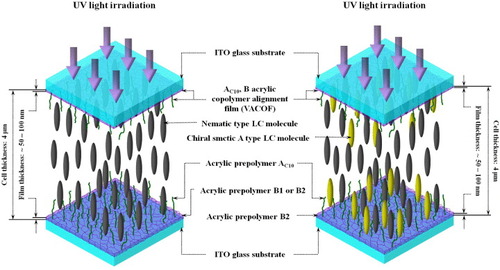
Figure 3 Tilt angle θ of LC molecules deduced by comparing projection length d of LC molecules (obtained from XRD data) with theoretical length L.
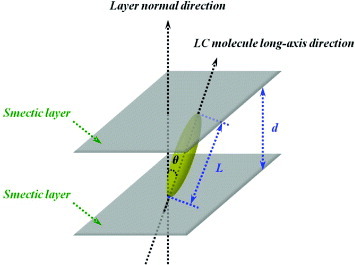
Figure 4 Electrooptical effects related to photoinduced vertical alignment. (a) Dark state before application of voltage. (b) Bright state after application of voltage.
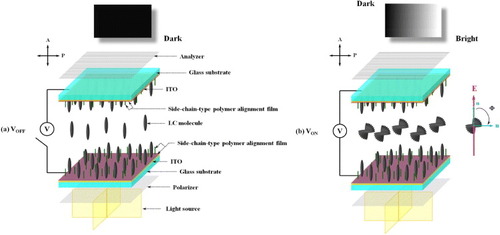
Figure 5 Definitions of rise time (τon) and fall time (τoff) of LC molecule orientation.
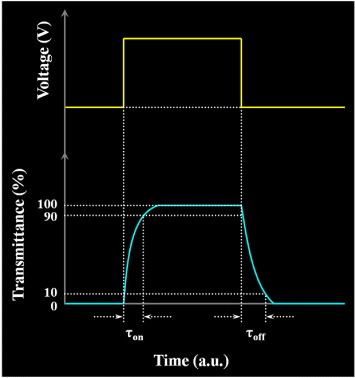
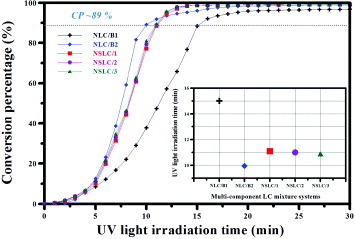
Figure 6 UV conversion percentages of NLC/B1, NLC/B2, NSLC/1, NSLC/2 and NSLC/3 mixtures versus UV irradiation time (inset: time required to reach 89% conversion).
Phase-transition temperatures deduced from DSC thermograms, enthalpies of transitions, and optical textures observed with POM during second cooling (cell thickness 4 μm). The phase-transition temperatures were taken at the maxima of endothermic and exothermic DSC peaks during the second heating and cooling cycles at 5 °C min-1. For the heating and cooling processes, we used positive (negative) values for endothermic (exothermic) variations in enthalpy. Cr=crystalline, N=nematic and I=isotropic liquid phase; •=phase exists.
Figure 7 Spacing between SmA∗ LC layers as function of temperature during cooling from isotropic liquid phase. Top row: photographs and conoscopic patterns of SmA∗ LC compound. The inset in the main figure shows the structure and length of the SmA∗ LC molecule simulated with the CS Chem3D Ultra software. The right part shows the XRD patterns of the SmA∗ compound. I=isotropic liquid phase; Cr1,2=crystalline phase 1, 2.
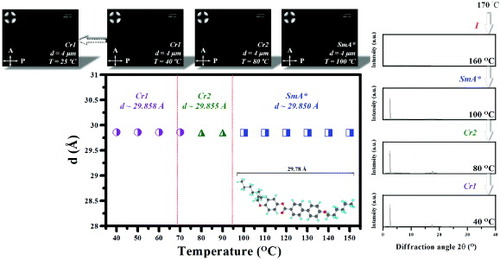
Figure 8 Transmittance versus applied voltage for (a) NLC/B1, (b) NLC/B2, (c) NSLC/1, (d) NSLC/2 and (e) NSLC/3 mixtures. Inset: POM images before and after a voltage was applied to the LC cells.
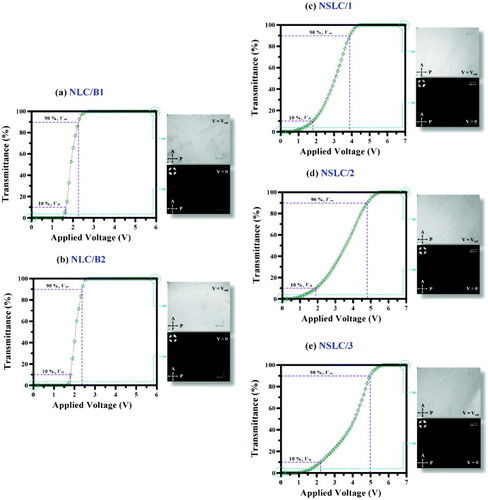
Threshold voltages (Vth), driving voltages (Von) and contrast ratios of LC mixtures.
Rise times (τon), fall times (τoff) and total response times (τtot) of LC mixture systems.