Figures & data
Figure 1 Chemical structure of MPC.
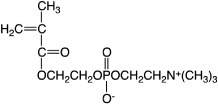
Figure 2 Schematic of molecular designs (a) and surface modification (b) performed with MPC polymer science.
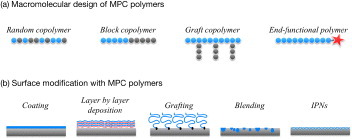
Figure 3 Chemical structure of BMB37.
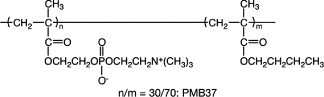
Figure 4 Preparation of a micropatterned poly(MPC) brush surface.
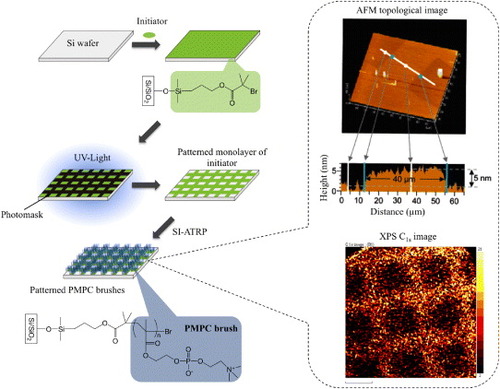
Figure 5 (a) Chemical structure of PMBN. (b) Schematic of one polymer nanoparticle embedding quantum dots within an artificial cell membrane surface. (c) Uptake of polymer nanoparticles covered with artificial cell membrane without and with R8 immobilization.
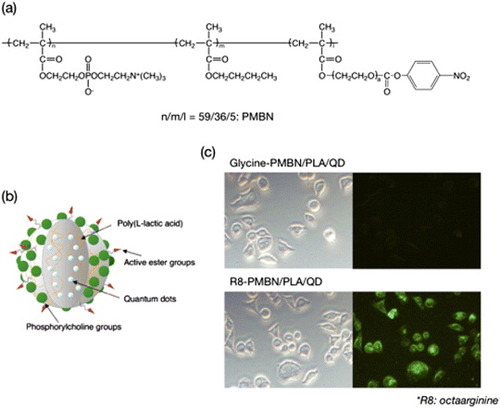
Figure 6 Biointerfacial aspects of MPC polymers.
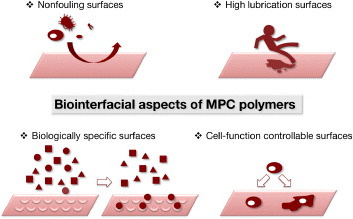
Figure 7 Microsphere columns after passage of whole blood for 15 min (left) and scanning electron microscopy images of polymer-coated beads packed in the columns (right).
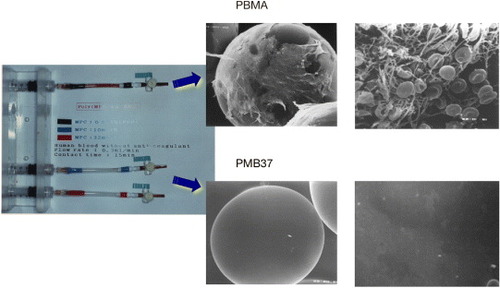
Figure 8. Change in cytoplasmic calcium ion concentration of platelets after contact with glass and PMB37 surfaces.
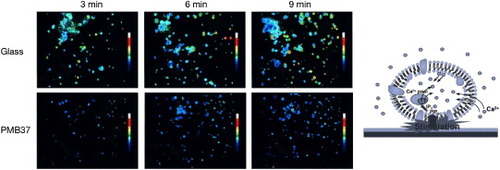
Figure 9 Profile of fibrinogen adsorption on poly(MPC)-grafted silicon surfaces with varying graft density and chain length in a tris-buffered saline buffer for 2 h at room temperature. Fibrinogen concentration: 1.0 mg ml−1. (Reprinted from [Citation91] with permission from Elsevier.)
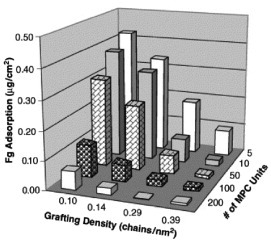
Figure 10 (a) Schematic of phospholipid bilayer microarray (PLBMA) decorated by well-defined poly(MPC) brushes. (b) Fluorescence micrographs of PLBMA containing: (i, iv) DOPC; (ii, v) 2.0 mol% GM1 in DOPC; (iii, vi) 2.0 mol% biotin-cap-DOPE in DOPC. The top row shows contact with each PLBMA and the Alexa 488-labeled 50 nM CTB (i, ii, iii); the bottom row shows contact with the Alexa 488-labeled 50 nM NeutrAvidin (iv, v, vi) in human plasma.
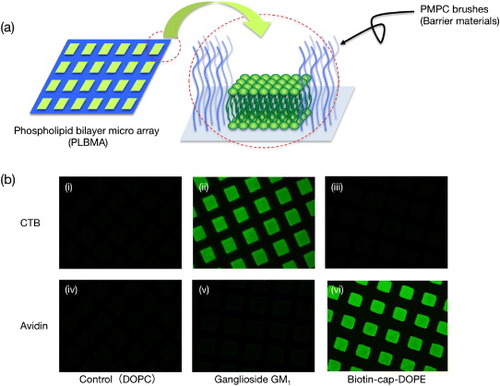
Figure 11 (a) Chemical structure of PMBL. (b) Density of adherent HepG2 and NIH-3T3 on PBMA and PMBL. (c) Confocal micrographs of adherent cells: (green) F-actin and (orange) phospholipid double layer.
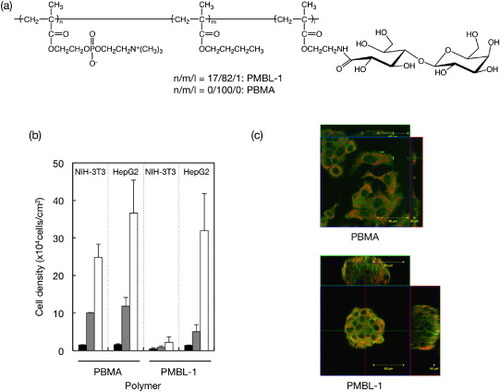
Figure 12 (a) Chemical structure of phospholipid PMBV. (b) Phase-contrast micrographs of adherent L929 cells after 24 h of cultivation on polymer surfaces. The bar corresponds to 100 μm. (c) RT-PCR results showing gene expression in C3H10T1/2 cells grown on polymer surfaces.
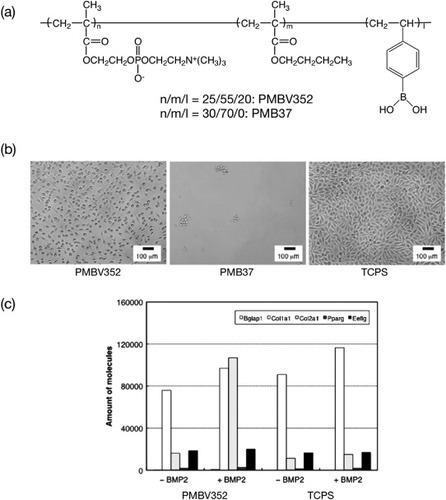
Figure 13 Biomedical and life science applications of MPC polymers.
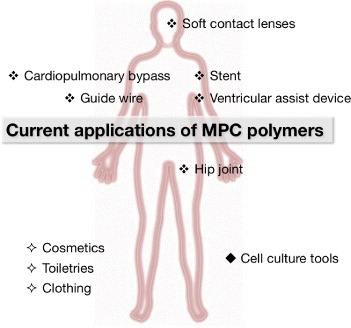
Figure 14 (a) EVAHEART VAD in the preferred anatomic placement for left ventricular support. The system consists of the inflow cannula, pump, outflow cannula, and lubricating purge system. The Cool-Seal purge system consists of a pump, ultrafiltration filter, and reservoir contained in a small case that can be carried by the patient. Water is recirculated through the system by the Cool-Seal pump, the ultrafiltration unit ensures sterility of fluid egressing the unit to the blood pump, and the reservoir can be exchanged or refilled as needed. (b) The concentrations of circulating activated platelets as quantified by annexin V binding or CD62P expression are shown for DLC-coated (N = 4) and MPC polymer-coated (N = 16) components. The days when the MPC values become significantly lower than the DLC values for annexin V () and CD62P (
) are marked above the curves. (c) Pump (MPC polymer coating) after 34 days of support without anticoagulation treatment. (Reprinted from [Citation146, Citation147] with permission from Wiley.)
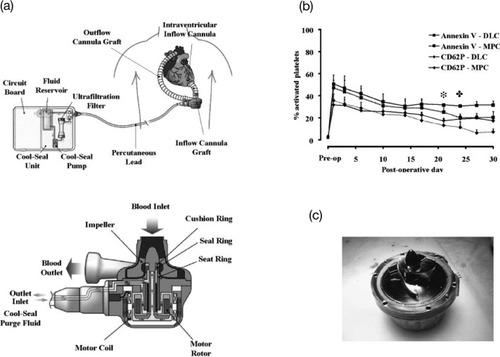
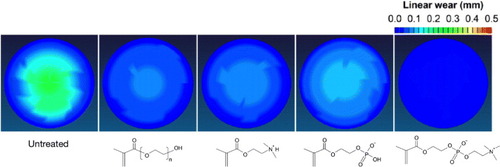
Figure 15 Spatial maps of wear in CLPE cups grafted with poly(MPC) or other polyelectrolytes after a hip simulator test.