Figures & data
Figure 1 Microdevice for cell-based assays. (a) Schematic with magnified views of the main components, (b) photograph, (c) phase-contrast micrograph of fibroblast cultured in the culture region.
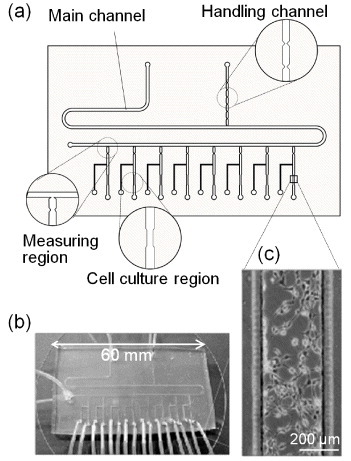
Figure 2 Handling of liquid plugs with the constriction-separated reservoirs (volume: 120 nl). (a) Operations for sequential dilution of a sample with the handling channel. (b) Measurement of a nanolitre plug of cell suspension in the measuring region and seeding of cells in the cell culture region. Arrows indicate the direction of applied pressure and the crossed circles mark closed ends (see movies in [Citation14]).
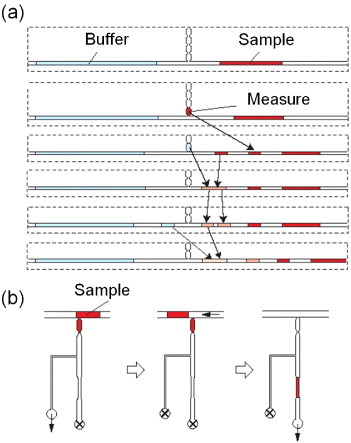
Figure 3 Characterization of cell seeding with plug-based liquid handling. (a) Distribution of the cell density in a culture dish. Representative images around the centre (1) and periphery (2) of a 35-mm culture dish after 12 h of culture. (b) Fibroblasts were introduced into the cell culture regions with the plug-based liquid handling. The inoculated cell density was 200 cells mm−2. (c) Comparison of the cell density distributions in the microdevice and a culture dish. The means and standard deviations were calculated from 24 experiments for the microdevice and nine experiments for the culture dish. (d) Serial dilutions of the cell suspension (density: 2.0 × 10⁶ cells ml−1) processed in the microdevice. The data represent the means and standard deviations from three independent experiments. (e) Preparation of cell suspensions with different compositions of two cell types. The cell densities represent the means and standard deviations from three independent experiments.
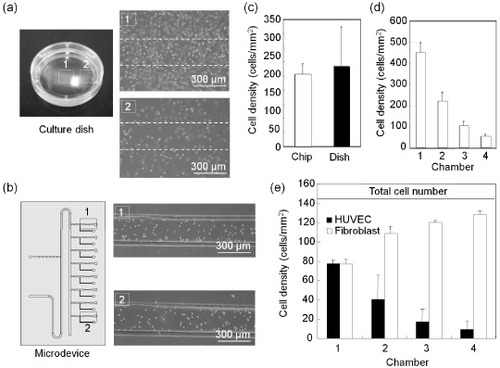
Figure 4 Validation of cell culture conditions in the microdevice. (a, b) Live/dead fluorescent staining of fibroblasts at 48 h of culture in the microsystem. The cytoplasm of live cells fluoresces green (a), whereas the nuclei of dead cells emit red light (b). (c) Comparison of the growth of fibroblasts in the microdevice () and in a culture dish (▪). The data present the means and standard deviations from three independent experiments.
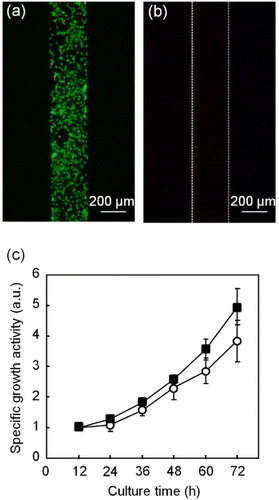
Table 1. Glucose consumption of fibroblasts during 12 h of culture.
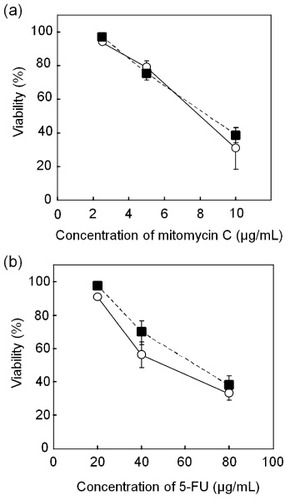
Figure 5 Susceptibility testing for two anticancer drug agents. After 12 h of culture, Hep G2 cells were exposed to the anticancer agents for 24 h, and their viability was quantified in the microdevice () and in a culture dish (▪). Responses to mitomycin C (a) and 5-FU (b). The data present the means and standard deviations from two independent experiments.