Figures & data
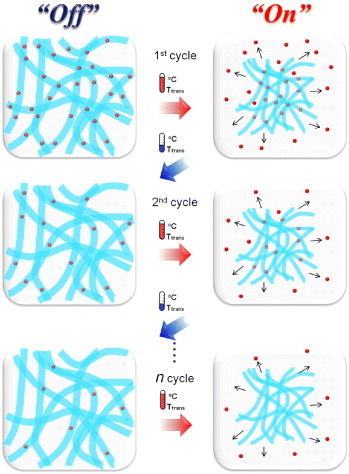
Figure 1 Schematic of the ‘on–off’ controlled release of dextran (red) from temperature-responsive NFs. Dextran-incorporated NFs offer the stepwise release of a certain amount of dextran within a short time in response to cycles of temperature alternation.
Scheme 1 Synthesis of poly(NIPAAm-co-HMAAm) and thermal crosslinking of the methylol group.
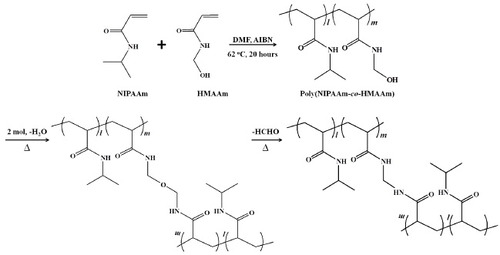
Table 1. Synthesis details and properties of poly(NIPAAm-co-HMAAm)s.
Figure 2 SEM images of NFs electrospun from PNH_3 (a, d), PNH_5 (b, e) and PNH_10 (c, f) solutions before (a–c) and after (d–f) thermal crosslinking at 110 °C for 7 h. Photographs of crosslinked PNH_10 NFs in PBS at 10 °C (g) and 45 °C (h). SEM image of the crosslinked PNH_10 NFs after one cycle of temperature alternation between 10 and 45 °C (i). Scale bars: 5 μm.
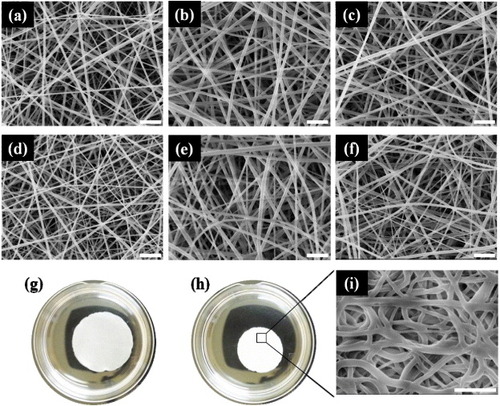
Figure 3 ATR-FTIR spectra of PNIPAAm (a), PNH_3 (b), PNH_5 (c) and PNH_10 (d) NFs before crosslinking. The shaded areas around 1050 and 3300 cm−1 are assigned to the stretching of C–O–H and –OH groups in HMAAm, respectively.
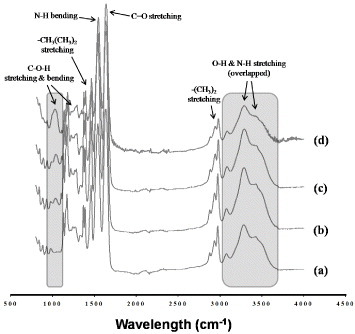
Figure 4 ATR-FTIR spectra of PNH_3 (a), PNH_5 (b) and PNH_10 (c) NFs at different times (0, 1, 3, 5 and 7 h) during the thermal treatment at 110 °C. The shaded areas around 1050 and 3300 cm−1 are assigned to the stretching of C–O–H and –OH groups in HMAAm, respectively.
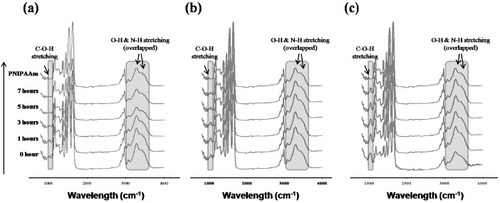
Figure 5 Effect of HMAAm content in PNH before (open circles) and after (solid circles) thermal crosslinking on LCST. The thermal crosslinking was carried out at 110 °C for 7 h. The LCSTs were determined from DSC peaks.
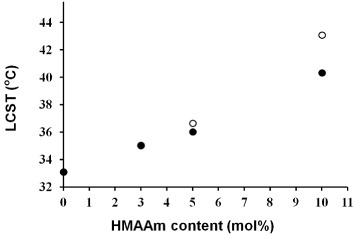
Figure 6 Temperature variations of swelling ratio for the crosslinked PNH_3 (triangles), PNH_5 (squares) and PNH_10 (circles) NFs in response to cycles of temperature alternation between 10 and 45 °C. The NFs were equilibrated at each temperature for 5 min, and their weights were measured.
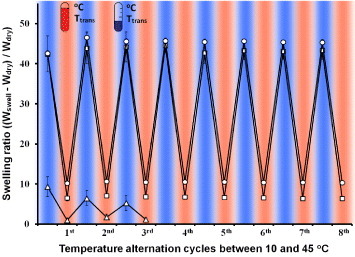
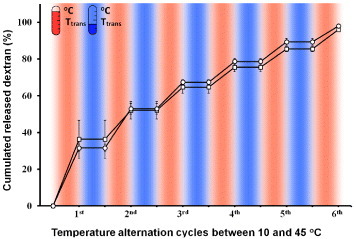
Figure 7 Release profiles of FITC-dextran from crosslinked PNH_5 (squares) and PNH_10 (circles) in response to cycles of temperature alternation between 10 and 45 °C. The NFs were incubated at each temperature for 5 min and the amounts of released FITC-dextran were measured.