Figures & data
Table 1. Chemical compositions (mass%) of the studied materials.
Figure 1 (a) Role and (b) equivalent circuit of the oxide film, (c) Cole–Cole plot.
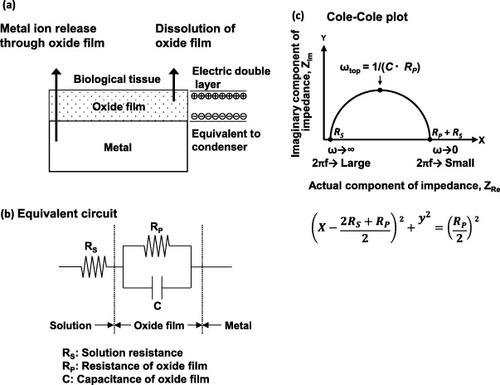
Figure 2 Experimental setup for electrochemical impedance measurement.
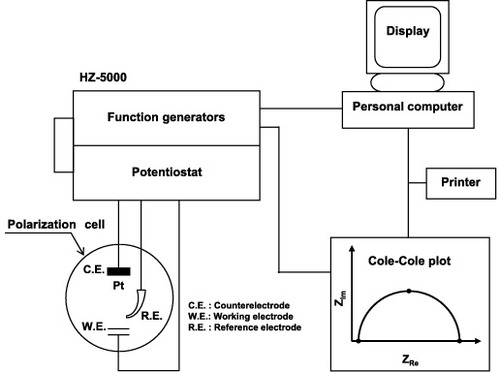
Figure 3 Effect of pH on the quantity of metal element released from Ti–6Al–4V alloy at 37 °C within 1 week: (a) Ti, (b) Al, (c) V and (d) total.
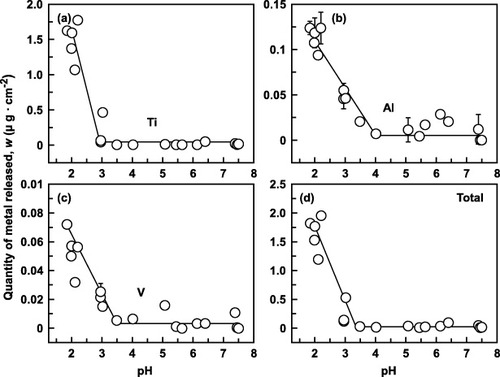
Figure 4 Effect of pH on the quantity of metal element released from Ti–15Zr–4Nb–4Ta alloy at 37 °C within 1 week: (a) Ti, (b) Zr, (c) Nb, (d) Ta and (e) total.
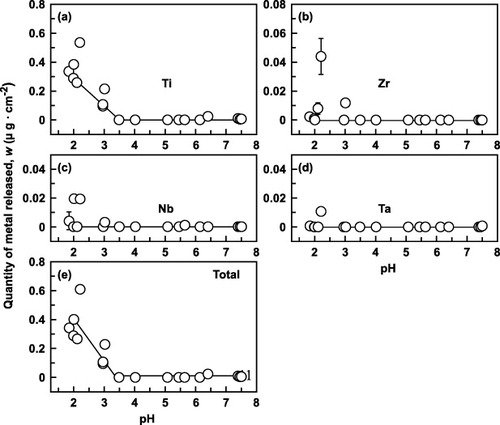
Figure 5 Anodic polarization curves of (a) Ti–6Al–4V and (b) Ti–15Zr–4Nb–4Ta alloys in 0.9% NaCl, Ringer's solution and Eagle's medium at 37 °C.
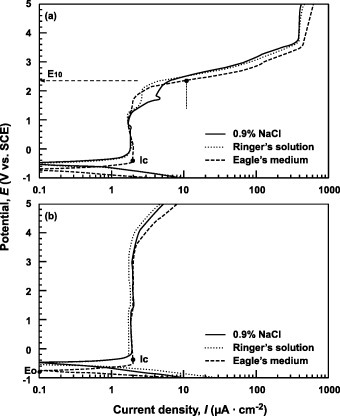
Figure 6 Effect of pH on anodic polarization curves of (a) Ti–6Al–4V and (b) Ti–15Zr–4Nb–4Ta alloys in 0.9% NaCl containing HCl (pH = 0.8, 2 and 4) at 37 °C.
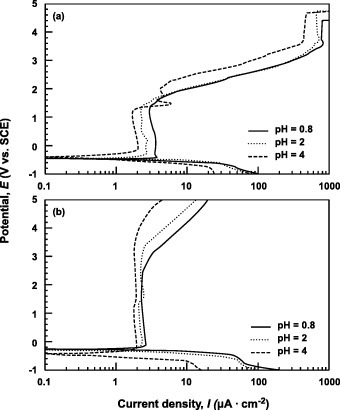
Figure 7 Effect of NaCl concentration on the anodic polarization curves of (a) Ti–6Al–4V and (b) Ti–15Zr–4Nb–4Ta alloys from 0.9 to 4.5% NaCl at 37 °C.
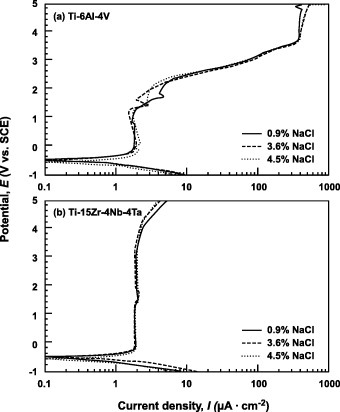
Figure 8 (a) Critical current density for passivation (Ic), and (b) potential at the current density of 10 μA cm−2 (E10) obtained from anodic polarization curves in various solutions with different pH values.
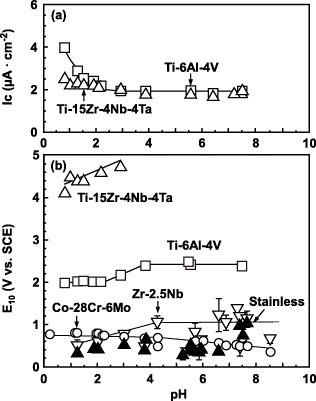
Figure 9 (a) FE-TEM image and (b) EDX analysis of the oxide film formed on the Ti–15Zr–4Nb–4Ta alloy surface by anodic polarization up to 0.5 V versus SCE in Eagle's medium at 37 °C.
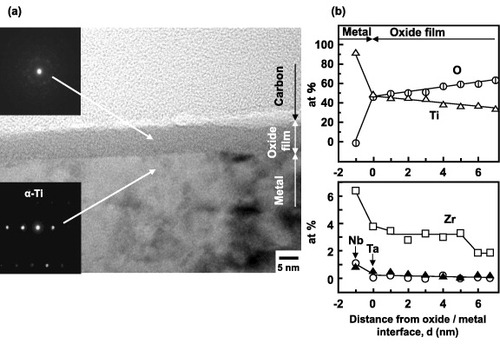
Figure 10 ARXPS spectra of an oxide film formed on the Ti–15Zr–4Nb–-4Ta alloy by anodic polarization up to 0.5 V versus SCE in Eagle's medium at 37 °C.
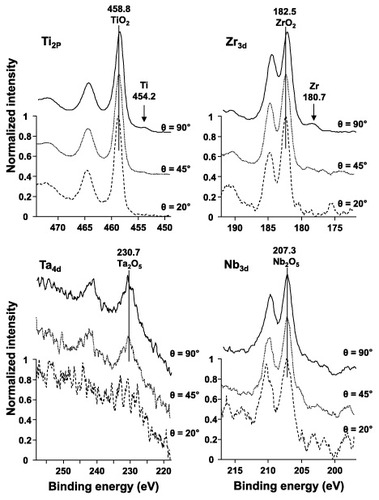
Figure 11 Effect of takeoff angle θ on the intensity ratio ITi /(ITiO2 + ITi) obtained by fitting the ARXPS spectra for the oxide film formed on the Ti–15Zr–4Nb–4Ta alloy surface by anodic polarization up to 0.5 V versus SCE in Eagle's medium at 37 °C.
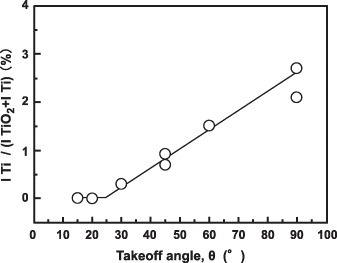
Figure 12 Schematic of ARXPS.
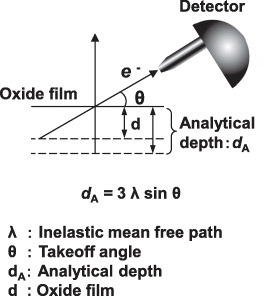
Figure 13 Effect of surface area on RS, RP and CPE of the oxide film formed on Ti–15Zr–4Nb–4Ta by anodic polarization up to 1.5 V versus SCE in 0.9% NaCl at 37 °C.
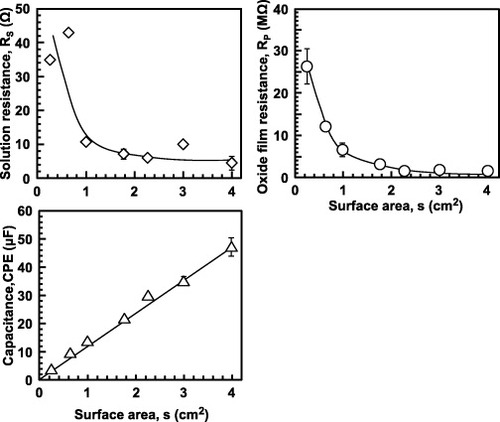
Figure 14 Effect of anodic potential on (a) thickness obtained by FE-TEM, (b) capacitance and (c) resistance (RP) of the oxide film formed on Ti–15Zr–4Nb–4Ta by anodic polarization in Eagle's medium at 37 °C.
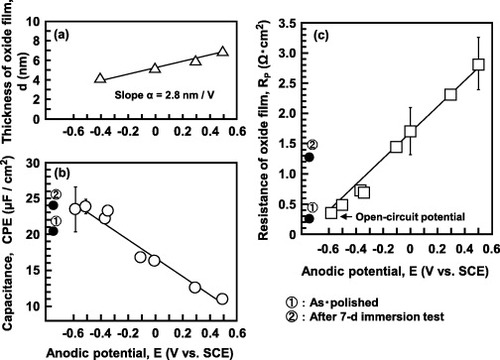
Figure 15 Effects of solution and potential difference between the open-circuit potential and anodic polarization potential (ΔE) on RP and CPE of the oxide film formed on Ti–15Zr–4Nb–4Ta by anodic polarization in various solutions at 37 °C.
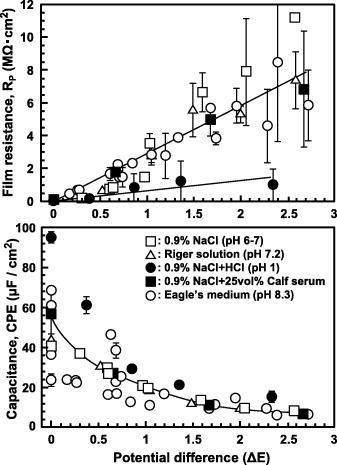
Figure 16 Effects of solution and material on (a) RP and (b) CPE of the oxide film after anodic polarization up to 0 V versus SCE in 0.9% NaCl and Eagle's medium at 37 °C.
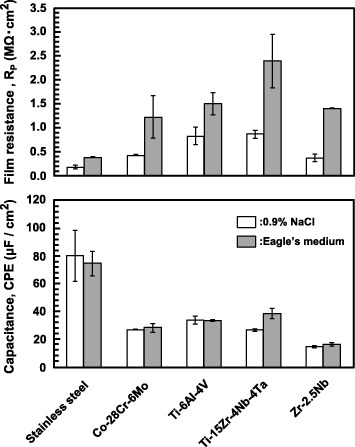
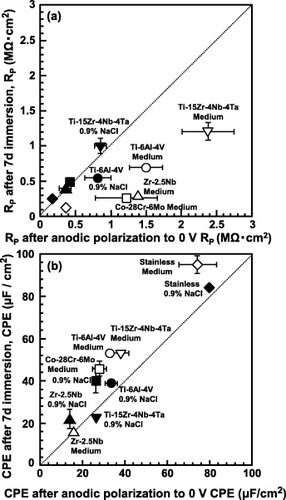
Figure 17 (a) RP and (b) CPE measured after anodic polarization up to 0 V versus SCE, and after 7-day immersion test in 0.9% NaCl and Eagle's medium at 37 °C.