Figures & data
Figure 1. Monodisperse spherical silica particles synthesized by the hydrolysis and condensation of TEOS. (Reprinted with permission from [Citation35], Elsevier Ltd © 1968.)
![Figure 1. Monodisperse spherical silica particles synthesized by the hydrolysis and condensation of TEOS. (Reprinted with permission from [Citation35], Elsevier Ltd © 1968.)](/cms/asset/e347c64b-f36d-4376-8dfb-32ec11f56fd0/tsta_a_11661360_f0001_oc.jpg)
Figure 2. (a) Argon adsorption isotherm of the monodisperse spherical nanoporous silica particles (inset: a pore size distribution calculated by the non-localized density functional theory) and (b) TEM image of a platinum-incorporated nanoporous silica particle. (Reprinted with permission from [Citation53], The Royal Society of Chemistry © 2003.)
![Figure 2. (a) Argon adsorption isotherm of the monodisperse spherical nanoporous silica particles (inset: a pore size distribution calculated by the non-localized density functional theory) and (b) TEM image of a platinum-incorporated nanoporous silica particle. (Reprinted with permission from [Citation53], The Royal Society of Chemistry © 2003.)](/cms/asset/78540a89-6de1-4455-b66e-49f5fb7b99aa/tsta_a_11661360_f0002_oc.jpg)
Figure 3. Illustration of an experimental setup using the flow reactor.
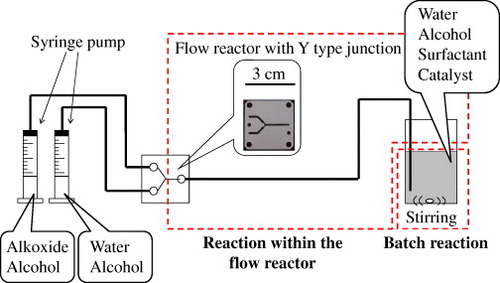
Figure 4. (a)–(d) SEM images and (e)–(f) particle size distributions of the silica-CTA+ particles with different CTAC/TEOS ratios in the starting solutions: (a), (e) 0.04; (b), (f) 0.08; (c), (g) 0.2; (d), (h) 0.4. (Reprinted with permission from [Citation58], American Chemical Society © 2010.)
![Figure 4. (a)–(d) SEM images and (e)–(f) particle size distributions of the silica-CTA+ particles with different CTAC/TEOS ratios in the starting solutions: (a), (e) 0.04; (b), (f) 0.08; (c), (g) 0.2; (d), (h) 0.4. (Reprinted with permission from [Citation58], American Chemical Society © 2010.)](/cms/asset/783db66f-1cb6-428e-9633-d69e155bc9b9/tsta_a_11661360_f0004_oc.jpg)
Figure 5. SEM images of nanoporous silica particles (scale bar: 50 nm for the main image). Inset: the magnified image of the particle. (Reprinted with permission from [Citation61], The Royal Society of Chemistry © 2009.)
![Figure 5. SEM images of nanoporous silica particles (scale bar: 50 nm for the main image). Inset: the magnified image of the particle. (Reprinted with permission from [Citation61], The Royal Society of Chemistry © 2009.)](/cms/asset/376d864e-9ff8-49a1-ad7b-799f6655bd9b/tsta_a_11661360_f0005_oc.jpg)
Figure 6. The particle size changes in isolated metal alkoxides versus reaction time under ambient conditions (25 °C, relative humidity 50%) in EtOH (100%). Symbols: Al, aluminum ethoxide; Si, tetraethylorthosilicate; Ti, titanium butoxide; Zr, zirconium butoxide; Nb, niobium ethoxide; Ta, tantalum ethoxide. (Reprinted with permission from [Citation64], American Chemical Society © 2006.)
![Figure 6. The particle size changes in isolated metal alkoxides versus reaction time under ambient conditions (25 °C, relative humidity 50%) in EtOH (100%). Symbols: Al, aluminum ethoxide; Si, tetraethylorthosilicate; Ti, titanium butoxide; Zr, zirconium butoxide; Nb, niobium ethoxide; Ta, tantalum ethoxide. (Reprinted with permission from [Citation64], American Chemical Society © 2006.)](/cms/asset/87325f29-cf33-49e8-8260-3acd1b8705b4/tsta_a_11661360_f0006_oc.jpg)
Figure 7. SEM image of titania–DDA hybrid particles after DDA removal and calcination. (Reprinted with permission from [Citation70], The Chemical Society of Japan © 2000.)
![Figure 7. SEM image of titania–DDA hybrid particles after DDA removal and calcination. (Reprinted with permission from [Citation70], The Chemical Society of Japan © 2000.)](/cms/asset/51859d3a-5658-4597-b854-6c5a96f28842/tsta_a_11661360_f0007_oc.jpg)
Figure 8. SEM images of titania–HDA particles synthesized with different H2O:Ti molar ratios: (a) 2:1, (b) 4:1, (c) 6:1, (d) 10:1, which were taken at the same magnification. (Reprinted with permission from [Citation77], American Chemical Society © 2010.)
![Figure 8. SEM images of titania–HDA particles synthesized with different H2O:Ti molar ratios: (a) 2:1, (b) 4:1, (c) 6:1, (d) 10:1, which were taken at the same magnification. (Reprinted with permission from [Citation77], American Chemical Society © 2010.)](/cms/asset/19c2f20c-8f83-4613-9757-8c65dd768afa/tsta_a_11661360_f0008_oc.jpg)
Figure 9. Size distributions of titania particles after mixing two starting solutions within the flow reactor for nucleation formation (dashed line) and after mixing the reaction solution with another starting solution in an open vessel for particle growth (solid line). (Reprinted with permission from [Citation115], The Ceramic Society of Japan © 2011.)
![Figure 9. Size distributions of titania particles after mixing two starting solutions within the flow reactor for nucleation formation (dashed line) and after mixing the reaction solution with another starting solution in an open vessel for particle growth (solid line). (Reprinted with permission from [Citation115], The Ceramic Society of Japan © 2011.)](/cms/asset/392f8e5c-5cec-4370-b9ea-a9ad1a1131a0/tsta_a_11661360_f0009_oc.jpg)
Figure 10. (a) SEM images of the as-synthesized titania–silica–ODA hybrid particles with different Si/Ti ratios. (b) TEM images of the titania–silica hybrid particles with different Si/Ti ratios. The upper three images show the as-synthesized particles, while the middle three images represent the particles after the extraction of ODA and the calcination in air at 800 °C for 1 h. The elemental maps of O, Si and Ti are shown on the right side of each TEM image. The lower three images magnify the regions marked by red squares in the middle images. (Reprinted with permission from [Citation108], Royal Society of Chemistry © 2012.)
![Figure 10. (a) SEM images of the as-synthesized titania–silica–ODA hybrid particles with different Si/Ti ratios. (b) TEM images of the titania–silica hybrid particles with different Si/Ti ratios. The upper three images show the as-synthesized particles, while the middle three images represent the particles after the extraction of ODA and the calcination in air at 800 °C for 1 h. The elemental maps of O, Si and Ti are shown on the right side of each TEM image. The lower three images magnify the regions marked by red squares in the middle images. (Reprinted with permission from [Citation108], Royal Society of Chemistry © 2012.)](/cms/asset/819ad115-9ec9-4666-b16e-d0c2238d482a/tsta_a_11661360_f0010_oc.jpg)
Figure 11. Photocatalytic decomposition of methylene blue by the titania–silica hybrid particles with different Si/Ti atomic ratios (▪: Si/Ti = 0; : Si/Ti = 0.19;
: Si/Ti = 0.94;
: Si/Ti = 1.5) after the removal of ODA and calcination in air at 800 °C for 1 h. (Reprinted with permission from [Citation108], Royal Society of Chemistry © 2012.)
![Figure 11. Photocatalytic decomposition of methylene blue by the titania–silica hybrid particles with different Si/Ti atomic ratios (▪: Si/Ti = 0; : Si/Ti = 0.19; : Si/Ti = 0.94; : Si/Ti = 1.5) after the removal of ODA and calcination in air at 800 °C for 1 h. (Reprinted with permission from [Citation108], Royal Society of Chemistry © 2012.)](/cms/asset/eb7ef85a-d511-461c-812e-8bbf72a899c9/tsta_a_11661360_f0011_oc.jpg)
Figure 12. (a) SEM images of products with different molar zirconia/titania ratios: 1st row: as synthesized; 2nd row: after removing ODA; 3rd row: after removal of ODA and calcination at 600 °C. (b) Particle size distributions of products with different Ti/Zr ratios. Average particle size and coefficient of variation (CV) are shown in each graph. (Reprinted with permission from [Citation115], The Ceramic Society of Japan © 2011.)
![Figure 12. (a) SEM images of products with different molar zirconia/titania ratios: 1st row: as synthesized; 2nd row: after removing ODA; 3rd row: after removal of ODA and calcination at 600 °C. (b) Particle size distributions of products with different Ti/Zr ratios. Average particle size and coefficient of variation (CV) are shown in each graph. (Reprinted with permission from [Citation115], The Ceramic Society of Japan © 2011.)](/cms/asset/e43215e4-55b6-465c-84dc-96c844d99489/tsta_a_11661360_f0012_oc.jpg)
Figure 13. (A) Nitrogen adsorption/desorption isotherms and (B) BJH pore size distributions of products with different Zr/Ti ratios after removal of ODA and calcination at 600 °C. V indicates the volume of gas adsorbed at standard temperature and pressure (STP) conditions. Open symbols and closed symbols represent adsorption and desorption isotherms, respectively. (Reprinted with permission from [Citation115], The Ceramic Society of Japan © 2011.)
![Figure 13. (A) Nitrogen adsorption/desorption isotherms and (B) BJH pore size distributions of products with different Zr/Ti ratios after removal of ODA and calcination at 600 °C. V indicates the volume of gas adsorbed at standard temperature and pressure (STP) conditions. Open symbols and closed symbols represent adsorption and desorption isotherms, respectively. (Reprinted with permission from [Citation115], The Ceramic Society of Japan © 2011.)](/cms/asset/9d3033b3-500a-478b-ba13-928a301cc908/tsta_a_11661360_f0013_oc.jpg)
Figure 14. (a) SEM and (b) TEM images of the Eu3+-doped nanoporous silica spheres (inset: magnified TEM image of the nanostructures) after the calcination. (Reprinted with permission from [Citation28], Elsevier Ltd © 2011.)
![Figure 14. (a) SEM and (b) TEM images of the Eu3+-doped nanoporous silica spheres (inset: magnified TEM image of the nanostructures) after the calcination. (Reprinted with permission from [Citation28], Elsevier Ltd © 2011.)](/cms/asset/ada8f799-5cb4-47db-873c-3dc59a1db695/tsta_a_11661360_f0014_oc.jpg)
Figure 15. Photoluminescence spectra of the Eu3+-doped nanoporous silica spheres. The Eu/Si ratio is 2.5 mol% (2.5-Eu-doped nanoporous silica (Eu:NPS)), 5.0 mol% (5.0-Eu:NPS) and 10.0 mol% (10.0-Eu:NPS). (Reprinted with permission from [Citation123], Elsevier Ltd © 2011.)
![Figure 15. Photoluminescence spectra of the Eu3+-doped nanoporous silica spheres. The Eu/Si ratio is 2.5 mol% (2.5-Eu-doped nanoporous silica (Eu:NPS)), 5.0 mol% (5.0-Eu:NPS) and 10.0 mol% (10.0-Eu:NPS). (Reprinted with permission from [Citation123], Elsevier Ltd © 2011.)](/cms/asset/b906ce2a-eb8d-482c-b5be-eedaf10ee8de/tsta_a_11661360_f0015_oc.jpg)
Scheme 1. Immobilization scheme of (i) APTES and (ii) folic acid molecules on the Eu3+-doped nanoporous silica (Eu:NPS) surfaces. (Reprinted with permission from [Citation29], Royal Society of Chemistry © 2011.)
![Scheme 1. Immobilization scheme of (i) APTES and (ii) folic acid molecules on the Eu3+-doped nanoporous silica (Eu:NPS) surfaces. (Reprinted with permission from [Citation29], Royal Society of Chemistry © 2011.)](/cms/asset/0f323b1a-e0c5-4842-a043-f0bfd48a3ddc/tsta_a_11661360_f0016_oc.jpg)