Figures & data
Figure 1. (a) TEM image of PS-b-PAA-b-PEG micelles and (b) AFM image of DOX/PS–PAA–PEG. The scale bar is 50 nm.
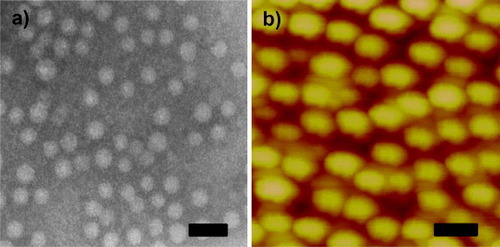
Figure 2. Hydrodynamic diameter of PS-b-PAA-b-PEG micelles at pH (a) 7.4 and (b) 4.5, respectively.
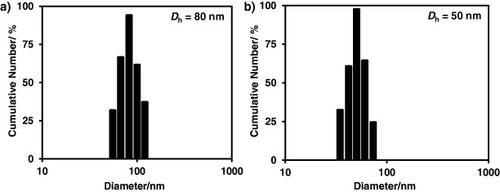
Figure 3. (a) Absorption and (b) fluorescence spectra of (1) DOX and (2) DOX/PS–PAA–PEG, respectively.
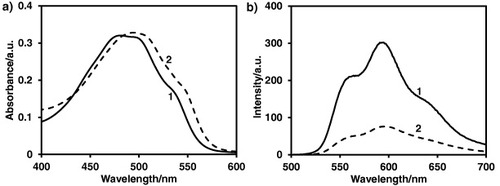
Figure 4. (a) Dh and (b) ζ of DOX/PS–PAA–PEG as a function of DOX molar ratio. The concentration of polymer is fixed at 0.2 g l−1.
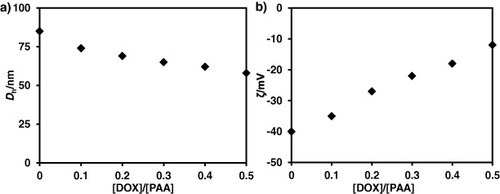
Figure 5. Drug release profiles of DOX/PS–PAA–PEG at pH 4.5 and 7.4.
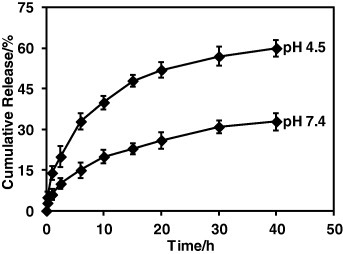
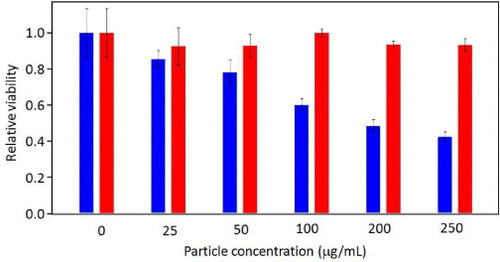
Figure 6. Relative viability of BT-20 cells evaluated by MTT assay with different dosages of DOX/PS–PAA–PEG (blue) and PS-b-PAA-b-PEG micelles (red).