Figures & data
Figure 1. The schematic illustration of the proposed TB diagnostic. Unknown extracted human DNA sequences were first hybridized with detection oligonucleotide sequences followed by addition of AuNPs colloid and triggering of the colorimetric sensing with a sodium chloride solution. If the extracted DNA sequences consisted of IS6110 target sequences, the detection oligonucleotide sequences would hybridize with them, and only a few ssDNA sequences would be absorbed on the AuNP surface to avoid aggregation after the addition of salt. In the absence of IS6110 target sequences, the color of the mixture remains red after hybridization and does not change. The mixture was then spotted, and concentrated on the chromatography paper confined by solid wax hydrophobic barriers. A smartphone was used to take images of the diagnostic results and transmit to a server for cloud computing.
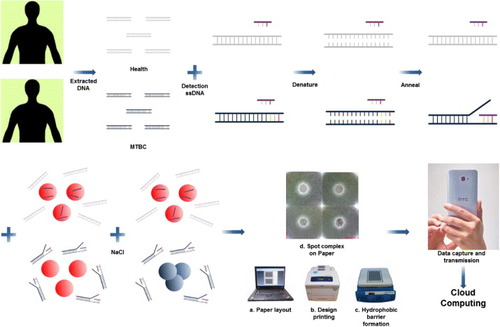
Figure 2. UV–Vis extinction spectra of unmodified AuNPs-based TB sensing. (I) The absorbance wavelength of the unmodified 13 nm AuNPs colloid centered at approximately 520 nm. (II) After addition of 25 mM salt into the AuNPs colloid, the salt induced the aggregation and the absorbance wavelength of the AuNPs colloid was red-shifted to ∼ 610 nm. (III) In the presence of 2.6 nM IS6110 target sequences, most of the detection oligonucleotide sequences would hybridize with them and would not provide extra negative charges on the AuNP surfaces to avoid aggregation when 25 mM salt was added. (IV) In contrast, the healthy control does not contain IS6110 target sequences, so the 1.3 nM detection ssDNA sequences would absorb on the AuNP surface to resist aggregation when 25 mM salt is added. The extinction ratio of Ext520/610 increases to ∼ 2.4 comparing to 1.7 for case (III). The inserted TEM image shows the diameter of synthesized AuNPs is 13 ± 1 nm.
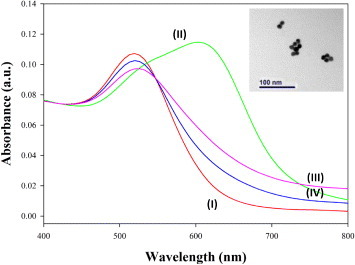
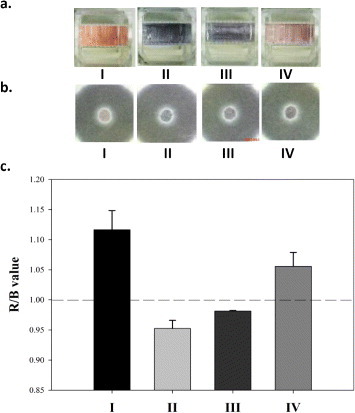
Figure 3. The colorimetric results of TB diagnosis (a) in cuvettes, (b) on paper and (c) the analytical values of red/blue of the spots. The four different solutions are (I) unmodified AuNPs colloid, (II) AuNPs colloid with 25 mM salt, (III) in the presence and (IV) absence of 2.6 nM IS6110 target sequences hybridized with detection ssDNA sequences in AuNPs colloid and then adding 25 mM salt. The colors in the cuvette are (I) red, (II) blue, (III) blue and (IV) red, and the mean R/B values of the spots on the paper are approximately 1.12, 0.96, 0.98 and 1.06, respectively (n = 3). The test conditions are identical to the UV–Vis extinction spectra test of figure except the volume needed for UV–Vis was 1 ml and the spotting volume in paper was 200 μl.