Figures & data
Figure 1. Illustration summarizing the concepts of the MUA modification of cubic PBNPs, the dODN drugs end-labeled with a FAM reporter and a linker, and the final configuration of the DNA nano drug (dODN@MUA–PBNPs) and its potential cancer cell-killing effect.
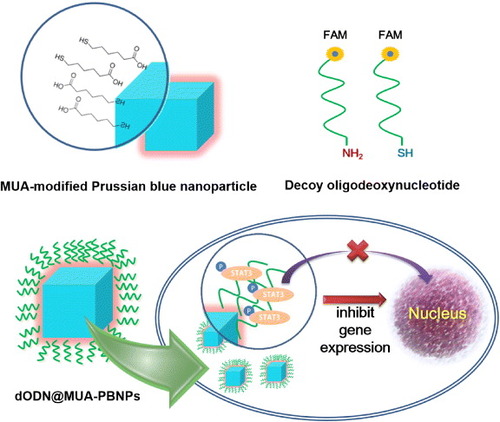
Figure 2. (a) TEM image of cubic PBNPs, (b) DLS size distribution analysis of cubic PBNPs, (c) FTIR characterization of cubic PBNPs and (d) TEM image of spherical PBNPs prepared under a different condition.
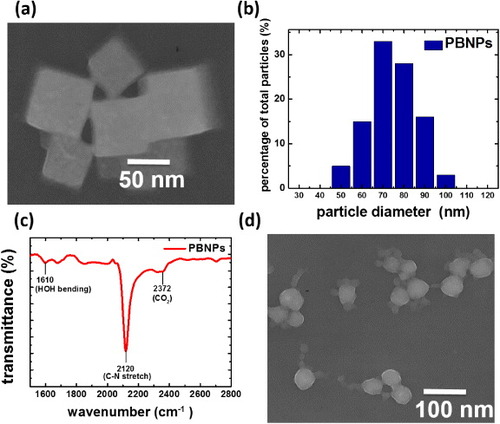
Figure 3. FTIR spectra of the as-prepared MUA-PBNPs from (a) 50 mM and (b) 5 mM MUA and those immersed in PBS after 12 and 24 h.
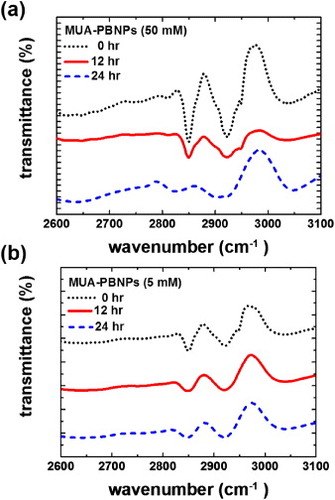
Figure 4. (a) Cell viabilities of 22rv1 carcinoma cells with bare-PBNPs and MUA-PBNPs. (b) Effect of MUA concentration for PBNPs modification on the cell viability. In this experiment, the MUA-PBNPs concentration is fixed at 300 μg ml−1.
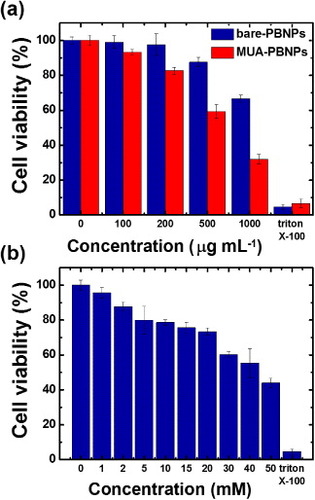
Figure 5. Characterization of dODN@MUA–PBNPs using UV–Vis and FTIR spectra.
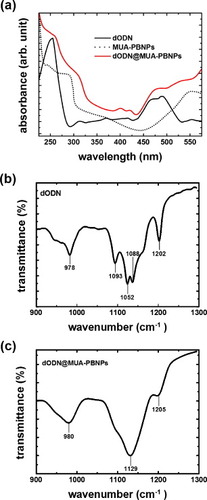
Figure 6. Confocal fluorescence microscopy images of the dODN@MUA–PBNPs treated 22rv1 cells: (a) blue fluorescence from the nuclei stained with DAPI, (b) green fluorescence from the FAM-labeled dODN, (c) the merged image of (a) and (b), and (d) the bright-field image of the cells.
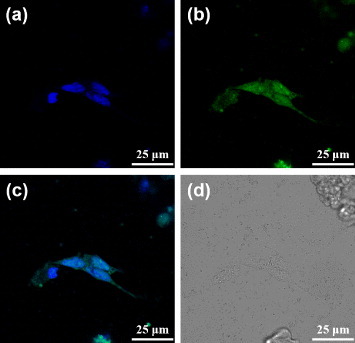
Figure 7. Confocal fluorescence microscopy images of the free dODN treated 22rv1 cells: (a) the channel for observing the nuclei stained with DAPI, (b) the channel for observing the FAM-labeled dODN, (c) the merged image of (a) and (b), and (d) the bright-field image of the cells.
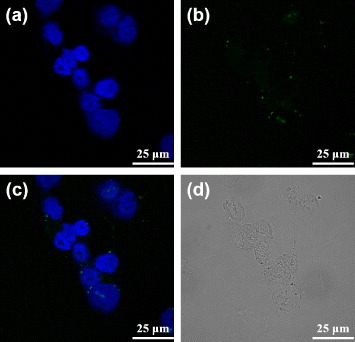
Figure 8. Confocal fluorescence microscopy images of the mixture (dODN and bare PBNPs) treated 22rv1 cells: (a) the channel for observing the nuclei stained with DAPI, (b) the channel for observing the FAM-labeled dODN, (c) the merged image of (a) and (b), and (d) the bright-field image of the cells.
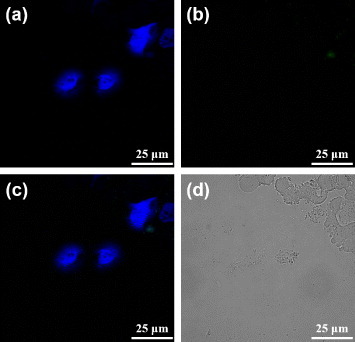
Figure 9. Cell viability test for the dODN@MUA–PBNPs with different incubation concentrations.
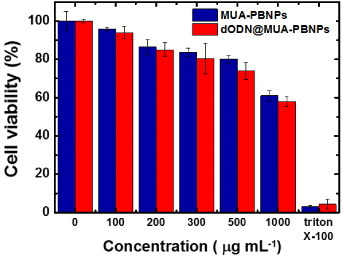
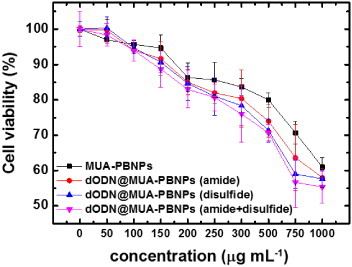
Figure 10. Cell viability tests for the dODN@MUA–PBNPs prepared with different grafting procedures and different incubation concentrations.