Figures & data
Figure 1. (a) Scheme of a martensitic sample consisting of a twinned two-variant configuration. (b) Detailed sketch of the twinning planes. The surface corrugation angle α is related to the c/a ratio of a unit cell. The phase can thus be determined via AFM surface relief analysis.
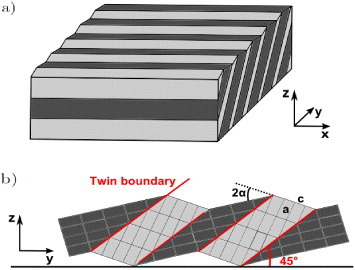
Figure 2. Amplitude error images of topography (left) and MFM phase contrast maps (right) of (a) as-deposited sample M1. The color-coded MFM contrast reveals magnetic stripe domains that are predominantly aligned normal to the martensite twin boundaries, which are visible due to the corresponding regular surface corrugation pattern. (b) Specimen M2 with topography predominantly free of the regular surface corrugation pattern, but a weaker stripe morphology. In this sample in-plane twinning occurs. Magnetic domains, located within these twin variants, show a more pronounced magnetic contrast than in regions with a regular twinned surface such as specimen M1. (c) As-deposited austenitic sample A. The magnetic domain patterns are very similar to the martensitic sample. Due to lower film corrugations, magnetic domains with one preferential orientation can be observed.
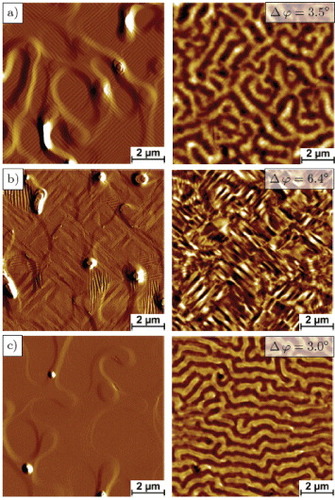
Figure 3. XRD measurements of epitaxially grown single-crystalline Fe7Pd3 thin films on MgO: (i) at the martensite–austenite phase transition with fcc austenite and different martensite variants (sample M1); (ii) a prevalent austenite film (sample A). The Fe bcc (110) peak originates from iron precipitations between substrate and Fe7Pd3 thin film, as discussed before [Citation9].
![Figure 3. XRD measurements of epitaxially grown single-crystalline Fe7Pd3 thin films on MgO: (i) at the martensite–austenite phase transition with fcc austenite and different martensite variants (sample M1); (ii) a prevalent austenite film (sample A). The Fe bcc (110) peak originates from iron precipitations between substrate and Fe7Pd3 thin film, as discussed before [Citation9].](/cms/asset/c8ba8d8c-5355-4b13-aba9-278cc00910d5/tsta_a_11668622_f0003_oc.jpg)
Figure 4. Cross-sectional SEM images of sample M2 cut with FIB parallel to the substrate edge and to the (100)A plane respectively, in different sample regions. (a) The typical corrugation pattern is characterized by twin boundaries aligned parallel to the MgO substrate edges and under 45° to the substrate surface (parallel to the (101)A plane). (b) The twin boundaries in the weak corrugated areas of M2 align under 45° to the MgO substrate edges and normal to the surface plane (parallel to the (110)A plane). For better visualization, the contrast of the SEM images was increased.
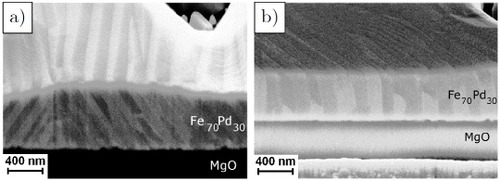
Figure 5. (a) Amplitude error image of topography (left) and MFM phase contrast map (right) of the freestanding specimen FS1. The amplitude error image reveals a line-shaped hierarchical twin structure. Lower microvariants (LM)—containing nanotwins and exhibiting poor out-of-plane magnetization—alternate with elevated untwinned microvariants (EM) yielding strong Mz component. (b) Height profile along the line marked in the amplitude error image and in the MFM phase contrast map; scheme of hierarchical variant morphology with only partially twinned microvariants. (c) Magnified view highlighting coinciding magnetic domain walls of neighboring microvariants (circle).
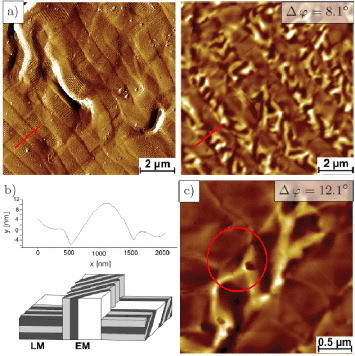
Figure 6. Height (left) and MFM phase (right) image of the substrate side of specimen FS2. No stripe-shaped microvariant structure can be observed anymore, but the height difference between twinned and untwinned areas as well as between regions with low and high magnetic contrast is much more pronounced.
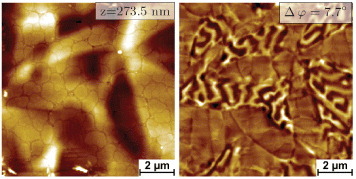
Figure 7. Amplitude error images of topography (left) and MFM phase contrast maps (right) of as-deposited sample M3 measured at five different temperatures between 293 and 370 K and after cooling down to room temperature.
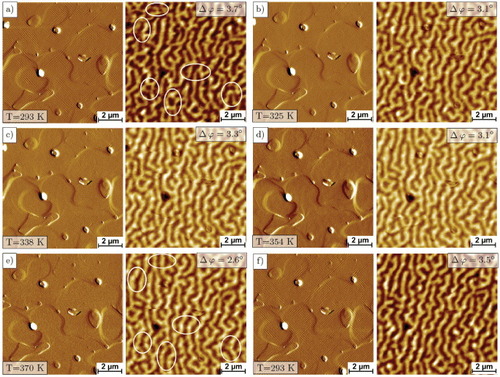
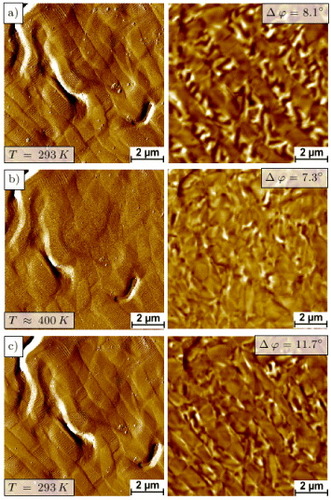
Figure 8. Amplitude error images of topography (left) and MFM phase contrast maps (right) of sample FS1 measured at room temperature and T ≈ 400 K as well as after cooling back down to room temperature. The given temperatures refer to the Peltier element.