Figures & data
Figure 1. A microfluidic paper-based electrochemical biosensor array that interfaces with a custom-made handheld potentiostat for multiplexed detection of metabolic biomarkers. (A) A paper-based electrochemical biosensor array (1 × 8). (B) A microcontroller-based multiplexing potentiostat mounted with a paper-based biosensor array. The potentiostat has eight measurement channels, and each channel is connected to a group of three sensing electrodes through metal clamps. CE: counter electrode. WE: working electrode. RE: reference electrode. (C) Schematic diagram of the potentiostat architecture with eight measurement channels. (D) A photograph of the paper-based biosensor array inserted into the potentiostat.
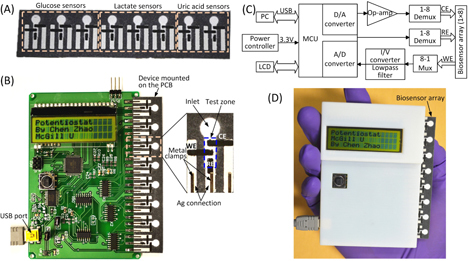
Figure 2. Electrochemical characterization of the paper-based biosensor array. (A) Typical cyclic voltammograms of 10 mM K3[Fe(CN)6] in 1 M KCl solution in an electrochemical biosensing module of the array device at various scan rates. (B) A plot of the cathodic peak current ipc versus the square root of the scan rate ν1/2, measured from the cyclic voltammograms (n = 5).
![Figure 2. Electrochemical characterization of the paper-based biosensor array. (A) Typical cyclic voltammograms of 10 mM K3[Fe(CN)6] in 1 M KCl solution in an electrochemical biosensing module of the array device at various scan rates. (B) A plot of the cathodic peak current ipc versus the square root of the scan rate ν1/2, measured from the cyclic voltammograms (n = 5).](/cms/asset/2f1e78ec-2b2a-4964-941e-f4dcee24812c/tsta_a_11668632_f0002_oc.jpg)
Figure 3. (A) Chronoamperometric curves and (B) the calibration plot for measurement of glucose in AU. The solid line in (B) represents a linear fit to experimental data with regression equation: y = 0.041x + 0.054 (R2 = 0.996, n = 5).
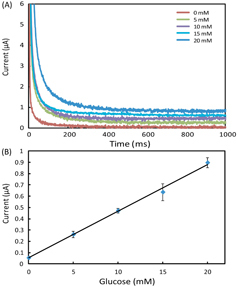
Figure 4. (A) Chronoamperometric curves and (B) the calibration plot for measurement of lactate in AU. The solid line in (B) represents a linear fit to experimental data with regression equation: y = 0.0076x + 0.025 (R2 = 0.995, n = 5).
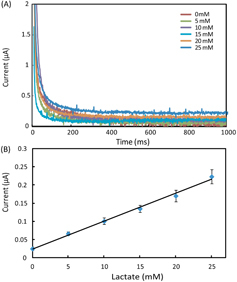
Figure 5. (A) Chronoamperometric curves and (B) the calibration plot for measurement of uric acid in AU. The solid line represents a linear fit to experimental data with regression equation: y = 0.048x + 0.029 (R2 = 0.994, n = 5).
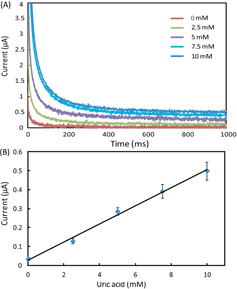
Table 1. Performance comparison of the paper-based biosensor array with commercial meters [Citation20] and μPAD in [Citation14].