Figures & data
Figure 1 Conceptualization of the TZP-matrix TE nanocomposite system, where abundant and environmentally safe 1D and/or 2D TE nanostructures forming an electrically conductive 3D network are embedded in a strong, tough, hard and wear-resistant TZP host matrix with a low thermal conductivity. The 3D network of TE nanostructures produces electricity from the temperature gradient, while nicely protected by the nanostructured TZP ceramic matrix, especially in mechanically harsh environments.
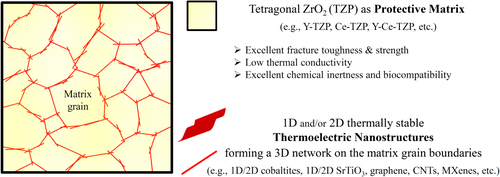
Figure 2 Processing of GO–3YSZ matrix nanocomposite (a) Bright-field TEM images of individual FL-GO nanosheets of our concentrated aqueous suspension, and their zeta potential–pH relationship in water; (b) uniform dispersion of the negatively charged FL-GO nanosheets within the positively charged 3YSZ nanoparticles, in water, by using a scalable, entirely aqueous and surfactant-free colloidal method, and fabrication of fully dense bulk by using SPS. Here, thermally reduced, conductive FL-GO nanosheets are considered as an example for 2D TE-nanostructures. The TG analysis (part b, weight loss–temperature graph) precisely determined the FL-GO content in the composite powder to be 2.65 wt%.
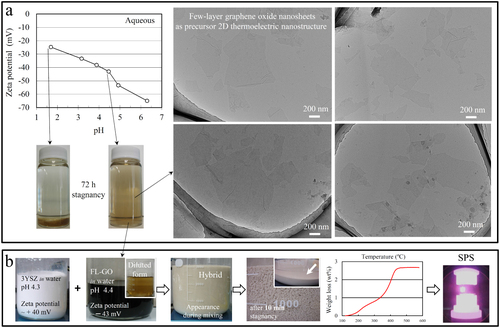
Figure 3 BF-STEM images of fully dense, spark plasma sintered FL-GO/3YSZ nanocomposite, clearly demonstrating its outstanding structural homogeneity in terms of FL-GO dispersion and 3YSZ grain size distribution. Thin interconnecting bright lines with highly comparable thicknesses are the FL-GO nanosheets, thermally reduced during SPS, and uniformly dispersed on the grain boundaries of nanostructured 3YSZ matrix.
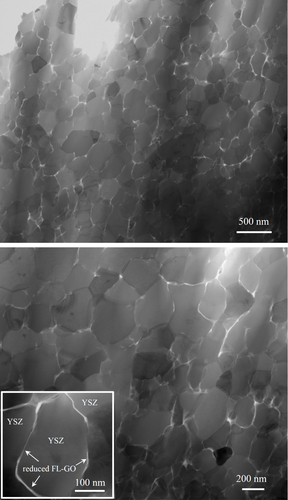
Figure 4 TEM images of fully dense, spark plasma sintered FL-GO/3YSZ nanocomposite. (a) Bright-field TEM images with different magnifications confirming the structural homogeneity of the nanocomposites in terms of GO dispersion and 3YSZ grain size distribution; (b) high-resolution TEM images of atomically intimate, pore-free GO/3YSZ interfaces; (c) STEM image with the corresponding STEM-EDS elemental mapping.
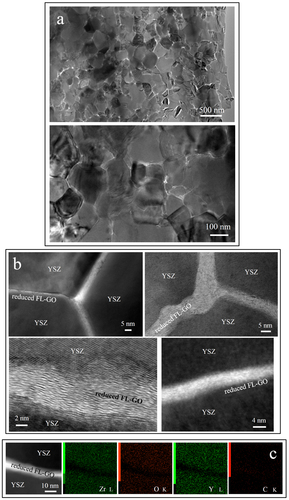
Figure 5 Fracture surfaces of fully dense, spark plasma sintered FL-GO/3YSZ nanocomposite. (a), (b) SEM images with different magnifications showing the exceptionally uniform dispersion of reduced FL-GO nanosheets within the structurally uniform, nanostructured 3YSZ matrix. (c), (d) TEM images of some individual FL-GO nanosheets partially pulled out from the 3YSZ matrix during fracture.
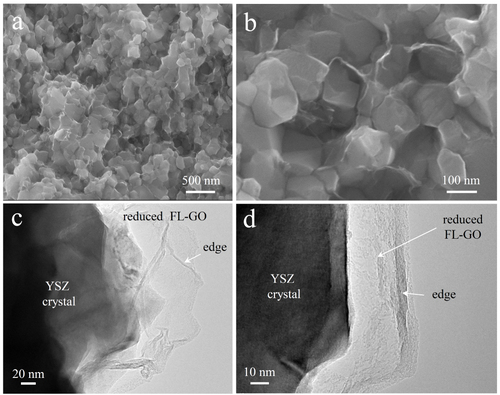
Figure 6 The relationships of the DC-electrical conductivity (a), Seebeck coefficient (b), thermal conductivity (c), power factor (d) and TE figure-of-merit, ZT (e) with the operating temperature, in the fully dense, spark plasma sintered FL-GO/3YSZ nanocomposite.
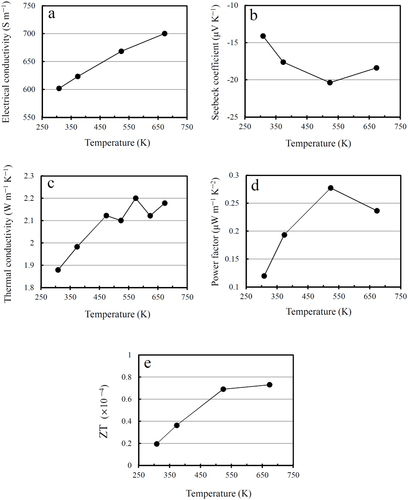
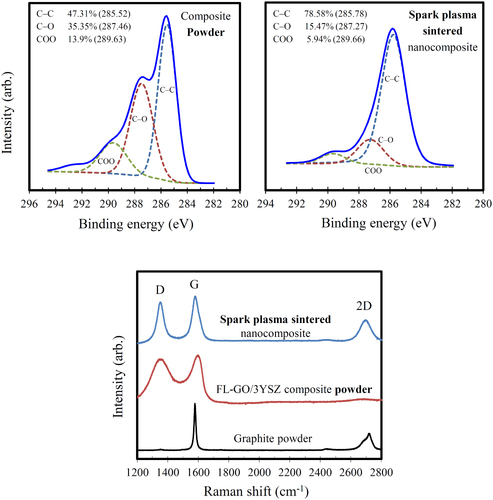
Figure 7 High-resolution C1 s XPS and Raman spectra of FL-GO nanosheets before and after the SPS.