Figures & data
Figure 1 XRD patterns of (a) non-textured surface, (b) textured SS and (c) textured TS of ZrB2 samples after sintering.
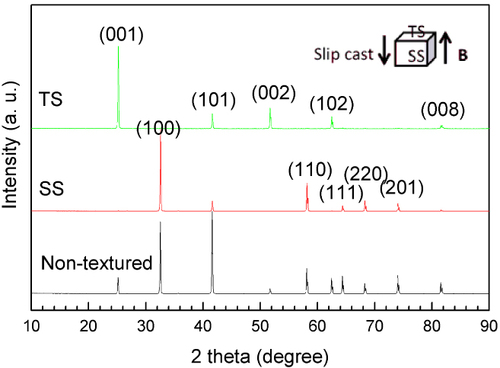
Table 1 Sintering temperature, densities, open porosities and ZrB2 grain sizes of the sintered ZrB2 ceramics.
Figure 2 SEM image of the starting ZrB2 powder.
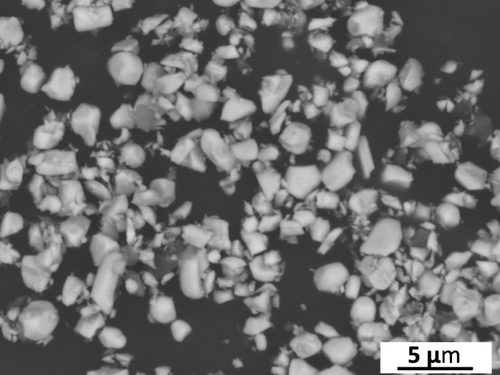
Figure 3 SEM images of polished surfaces for textured ZrB2 ceramics sintered at 1750 °C: (a) TS, (b) SS; and non-textured ZrB2 sintered at (c) 1750 °C and (d) 1700 °C.
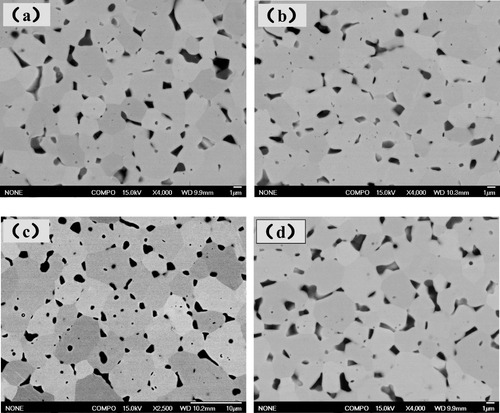
Figure 4 SEM image (top left) and compositional maps of the polished surface of non-textured ZrB2 sintered at 1750 °C for 5 min.
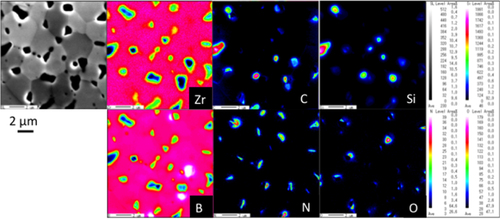
Figure 5 TEM pictures of the ZrB2 ceramics; (a) and (b) matched and mismatched ZrB2/ZrB2 grain boundaries; (c) BN flakes and amorphous phase located at the triple point of the matrix; (d) elemental analysis of the amorphous phase in (c).
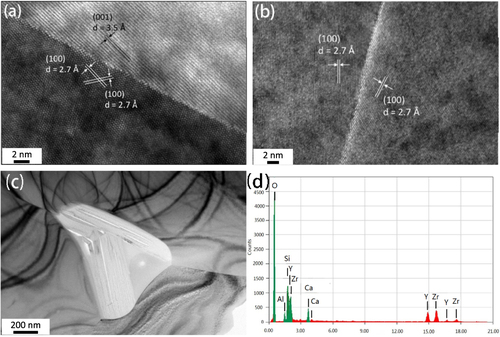
Table 2 Vickers hardness, Young's modulus and flexural strength at various conditions.
Figure 6 Flexural strength of textured and non-textured ZrB2 ceramics at room and elevated temperatures.
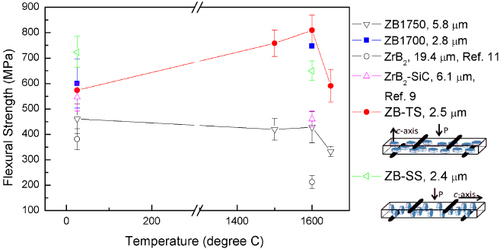
Figure 7 Load–displacement curves of the flexural strength tests of ZrB2 ceramics from room temperature to 1650 °C.
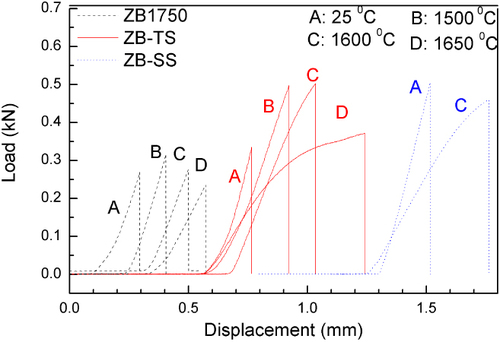
Figure 8 Tension side fracture surfaces of ZrB2 ceramics after flexural strength testing at room and high temperature. (a) ZB1750, room temperature (RT), (b) ZB1750, 1600 °C, (c) ZB1700, RT and (d) ZB1700, 1600 °C.
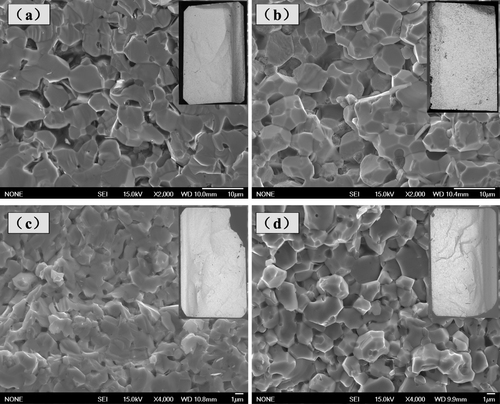
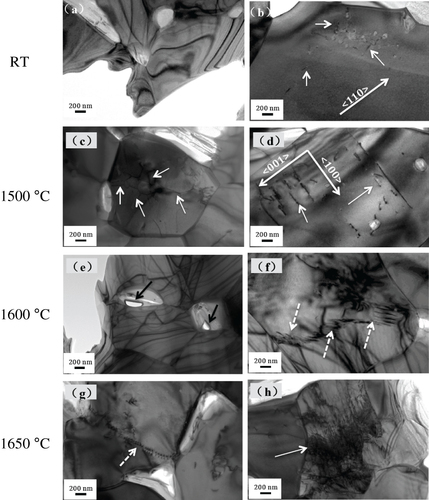
Figure 9 Bright-field TEM images show the successive growth of cavities at adjacent locations and the evolution of dislocations in tension surfaces of ZB1700 tested at different temperature. (a), (b) RT; (c), (d) 1500 °C; (e), (f) 1600 °C; (g), (h) 1650 °C. The white solid arrows indicate dislocations, the dashed arrows indicate sub-grain boundaries and the black solid arrows indicate the cavities formed at the triple points.