Figures & data
Scheme 1. Experimental details of phosphor synthesis.

Figure 1 XRD patterns of the hydrothermal products synthesized at 120 °C under different pH values, with (a) Ln(OH)SO4 (pH = 7.0), (b) Ln(OH)SO4 (pH = 7.5), (c) a phase mixture of Ln(OH)SO4 and Ln2(OH)4SO4·2H2O (pH = 8.0), (d) Ln2(OH)4SO4·2H2O (pH = 9.0) and (e) Ln2(OH)4SO4·2H2O (pH = 10.0).
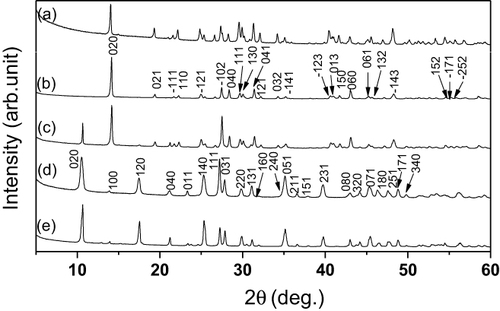
Figure 2 FE-SEM images of the hydrothermal products synthesized at 120 °C under pH values of (a) 7.0, (b) 9.0 and (c) 10.0.

Figure 3 FTIR spectra for precursors (a) S1 and (b) S4.
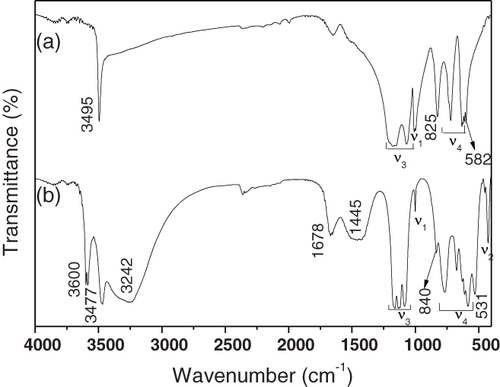
Figure 4 TGA/DSC profiles of precursor S4 (nanoplates).
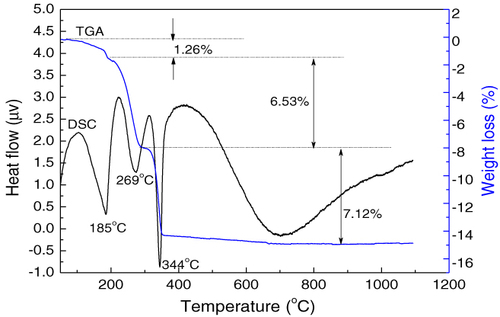
Figure 5 XRD patterns of the nanoplate precursor (a) and those calcined from (a) under flowing H2 (∼ 200 ml min−1) for 1 h at (b) 400, (c) 600, (d) 700, (e) 800, (f) 1000 and (g) 1200 °C. The standard diffractions of La2O2S (JCPDS No. 01-075-1930) are included as bars for comparison (h).
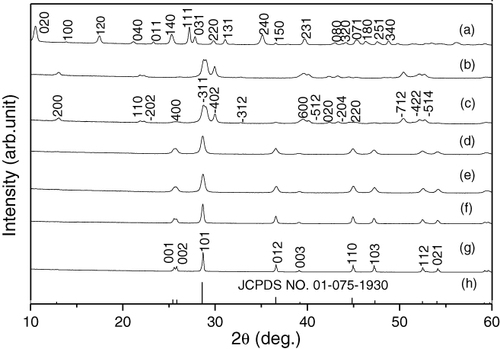
Figure 6 FE-SEM micrographs showing morphologies of the products calcined from precursors S4 (a)–(d) and S5 (e)–(h) at (a), (e) 400, (b), (f) 700, (c), (g) 1000 and (d), (h) 1200 °C for 1 h in flowing H2.
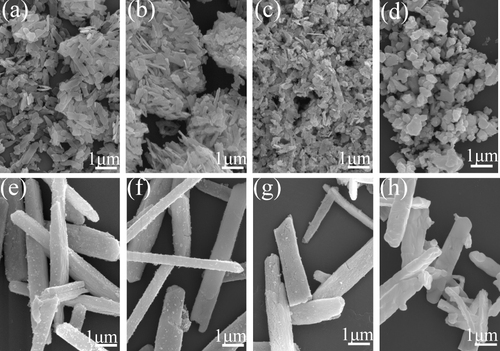
Figure 7 PLE and PL spectra of the (La,Eu)2O2S phosphors calcined from the nanoplate precursor (S4) at various temperatures for 1 h. The inset in panel (b) is the average crystallite size as a function of calcination temperature.
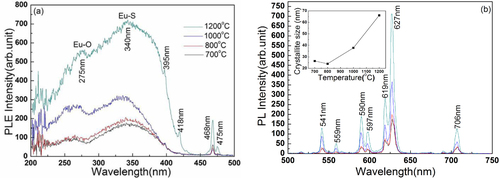
Figure 8 (a) PLE and (b) PL spectra of the (La,Eu)2O2S phosphors shown in figure (d) (rounded particles) and figure (h) (microprisms). The PLE spectra were recorded by monitoring the 627 nm emission while the PL spectra were taken under 340 nm excitation. The inset in part (b) is the appearance of red emission (digital photograph) of the phosphor powder shown in figure (d). The picture was taken under 254 nm irradiation of the phosphor from a hand-held UV lamp.
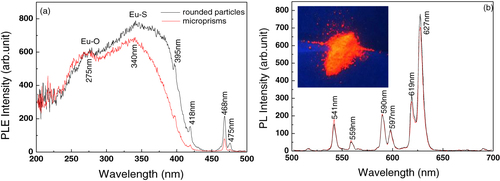
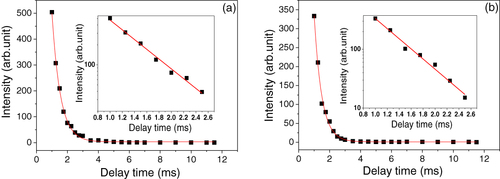
Figure 9 Fluorescence decay analysis of the 627 nm emission for (a) the rounded and (b) microprismatic (La,Eu)2O2S phosphor particles calcined in H2 at 1200 °C for 1 h. The insets are the semi-log (log I–t) plots of the decay data.