Figures & data
Figure 1 Schematic of graphene-based electrodes. (a) Single-layer graphene. Single-layer graphene has the highest surface area of 2630 m2 g−1, which can interface with electrolyte ions on both sides of the graphene. (b) Few-layer graphene. Graphene nanosheets are likely to agglomerate through van der Waals interactions during the drying process. It would be difficult for electrolyte ions to access the ultra-small pores, especially for larger ions such as those in an organic electrolyte, or at a high charging rate. (c) Graphene–CNT composite is coated with vertically aligned Co(OH)2 nano-sheets by cathodic in situ deposition to fabricate a graphene–CNT–Co(OH)2 composite. (d) Graphene–CNT composite. CNTs can serve as a spacer between the graphene nanosheets to provide rapid diffusion pathways for the electrolyte ions; moreover, they can increase the electrical conduction. The CNTs also serve as a binder to hold the graphene nanosheets together, preventing the disintegration of the composite in electrolyte.
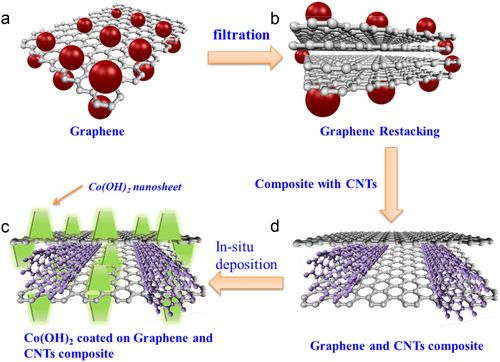
Figure 2 Morphological characterization of graphene-based structures. (a) TEM image of as-synthesized graphene at low magnification showing several overlapping graphene flakes. (b) TEM image of as-synthesized graphene at high magnification revealing the number of graphene layers in the few-layer graphene structure. (c) SEM image of a graphene–CNT composite with vertically aligned Co(OH)2 nanosheets’ coating at low magnification. (d) SEM image of Co(OH)2 coating at high magnification. The thickness of the Co(OH)2 nanosheet is approximately 10 nm.
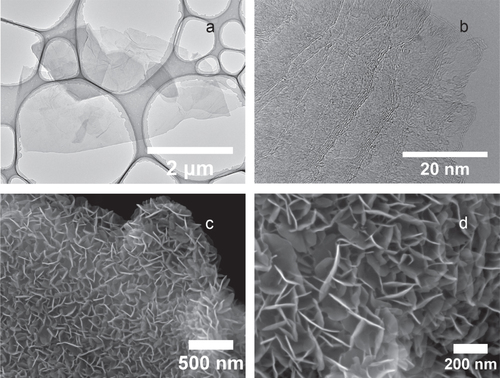
Figure 3 TEM image and elemental mapping of Co(OH)2-coated graphene. (a) TEM image of Co(OH)2-coated few-layer graphene. (b) Dark-field image of the same Co(OH)2-coated graphene piece combined with maps of carbon (c), oxygen (d) and cobalt (e).
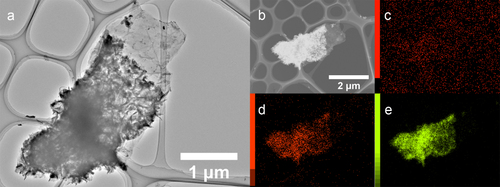
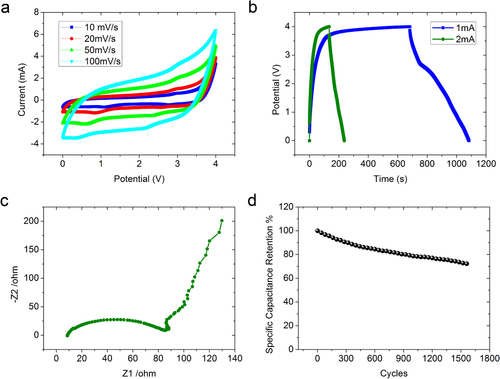
Figure 4 Electrochemical properties of Co(OH)2 coated graphene–CNT composite. (a) CV curves of graphene–CNT–Co(OH)2 composite at different scan rates ranging from 10 to 100 mV s−1 in EMI-TFSI electrolyte. (b) Galvanostatic charge/discharge curves of the composite at charging currents of 1 and 2 mA. (c) Nyquist plot of EIS data of graphene–CNT–Co(OH)2 composite electrode. (d) Cycling performance of graphene–CNT–Co(OH)2 composite at charging density of 2 A g−1.