
Figures & data
Table 1. List of each samples’ pretreatments and surface areas.
Figure 1 (A) Rate of H2 production versus reaction temperature during SRM over different catalysts: (AL; •) uncalcined QC catalyst, (AL(873); ▴) QC catalyst following calcination in air at 873 K, (BL; ○) unleached QC and (COM; ⋄) commercial catalyst. (B) XRD patterns for QC catalysts after different treatments. (C) H2-TPR profiles for AL, AL(873) and CuO samples obtained with heating rate of 5 K min−1 in 5% H2/Ar. (D) Rate of H2 production versus reaction temperature for SRM over different catalysts: (○) AL, (△) (AL(H873); blue ▴) reduction in H2 at 873 K and (AL(re873); red ▴) (blue ▴) followed by re-calcination in air at 873 K.
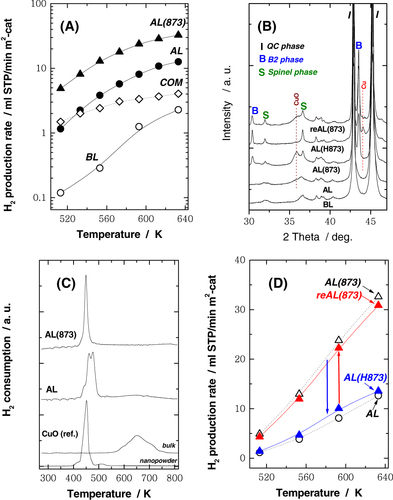
Figure 2 SEM images of surface of: (A) sample AL and (B) sample AL(873).
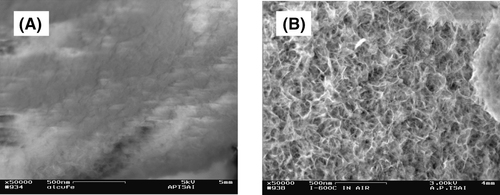
Figure 3 Cross-sectional TEM bright-field images of (A) sample AL and (B) sample AL(873). The SAED patterns were obtained from the corresponding regions indicated in (A) and (B).
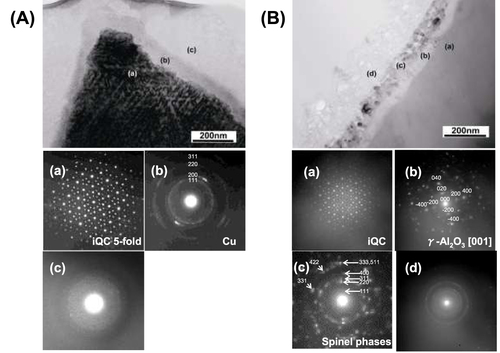
Figure 4 Cross-sectional STEM images of sample AL(873); EDS elemental maps for Al, Cu, Fe and O.
