Figures & data
Table 1. Primers for PCR amplification.
Figure 1 SEM images of the silica coated zirconia substrate. (A) Flat silica coating; micropatterned silica coatings with pillars (B) and parallel grooves (C). To evaluate the cell viability and metabolic activity of HGFs and HDMECs on the surfaces, the MTT assay was used. Data showed that the metabolic activity increased with culture time for both types of cells on all surfaces tested. Scale bar = 50 μm.
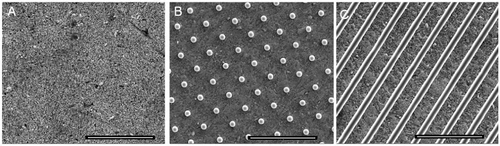
Figure 2 MTT activity assay for HGFs (A) and HDMECs (B) on flat, grooved and pillar surfaces. Negative and positive control results are also shown. Values reported are the mean ± SD. Assays were performed after 1, 3 and 7 days of culture; ∗ indicates significant statistical difference (p < 0.05; n = 3).
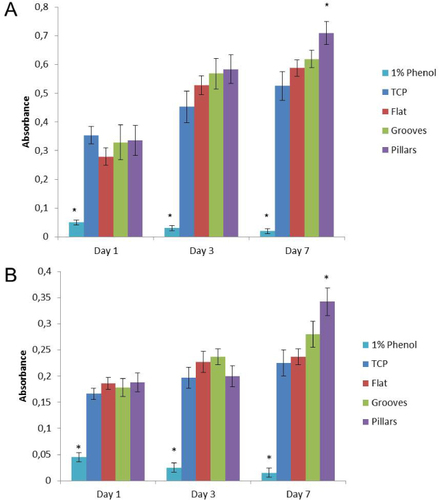
Figure 3 RT-PCR analysis of fibroblast and endothelial-associated markers: FSP-1, COL-1, CD31 and vWF, after 7 days of cell culture on TCP, flat, grooved and pillar surfaces. Panels (A) and (C) are representative agarose gel of PCR products. Panels (B) and (D) show densiometric analyses of PCR products, normalized to the corresponding GAPDH and β-actin value. Values reported are the mean ± SD; ∗, statistically significantly different (p < 0.05; n = 3).
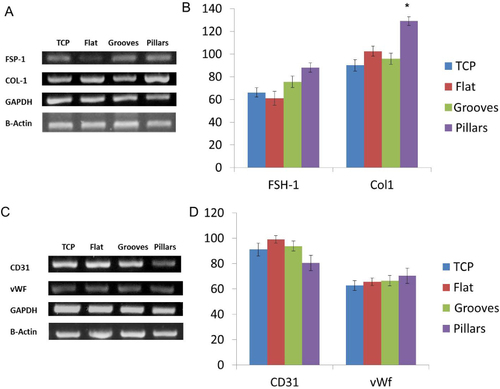
Figure 4 SEM images showing HFG and HDMEC morphology, after 1 day of culture on flat, grooved and pillar surfaces. Scale bar = 20 μm.
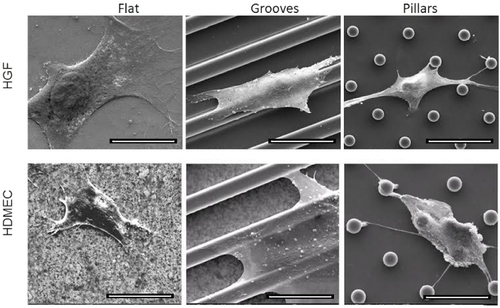
Figure 5 Inverted fluorescence microscopy images of HFGs and HDMECs after 7 days of culture, on flat, grooved and pillar surfaces. Scale bar = 50 μm.
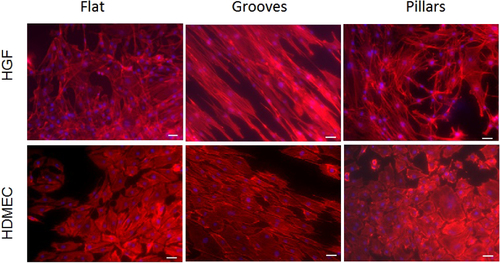
Figure 6 Matrigel assay images of capillary-like tube formation of HDMECs after 3 days of culture, on flat (a), grooved surfaces (b) and pillars (c). The direction of the parallel microtopographic features is indicated by the white arrow. Scale bar = 100 μm.
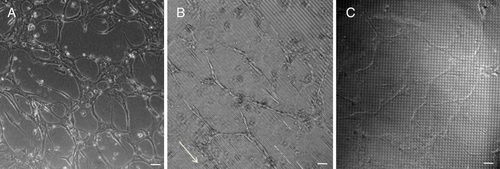
Figure 7 Evaluation of platelet adhesion and activation by SEM. Polypropylene (A), (B), zirconia (C), (D), flat silica (E), (F) and silica with grooves (G), (H) and with pillars (I), (J). (A), (C), (E), (G), (I) Scale bar = 100 μm; (B), (D), (F), (H), (J) scale bar = 20 μm.
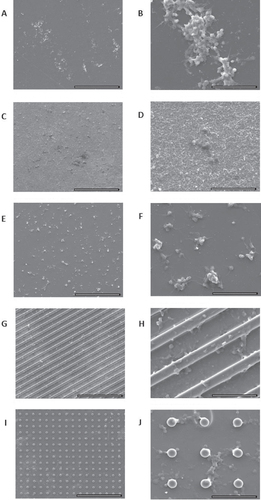
Figure 8 Platelet counts (A); APTT and PT (B), (C) for negative control (polypropylene membrane), zirconia, silica flat and micropatterned (grooves and pillars) surfaces.
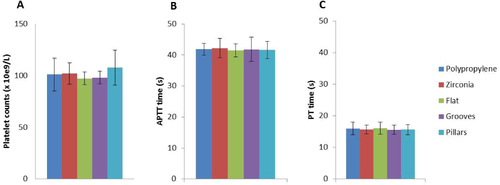
Figure 9 SEM images show bacterial morphology and distribution on zirconia (A), (B), flat silica (C), (D), silica with grooves (E), (F) and silica with pillars (G), (H). (A), (C), (E), (G) Scale bar = 40 μm; (B), (D), (F), (H) scale bar = 10 μm.
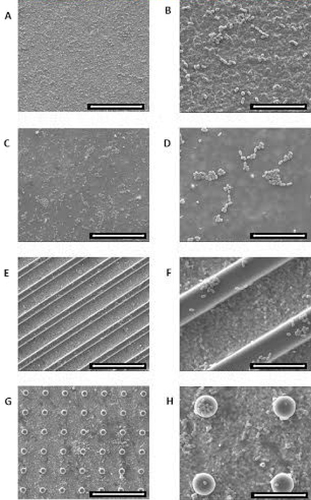
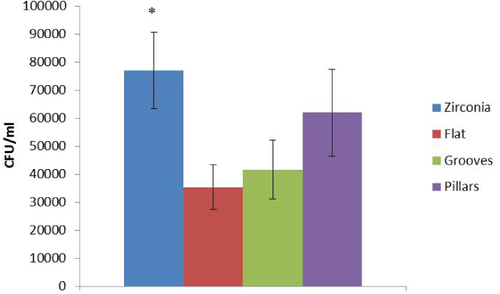
Figure 10 Bacterial adhesion on zirconia, flat silica, silica with grooves and silica with pillars. Values reported are the mean ± SD. Assays were performed after 90 min of culture; ∗ indicates significant statistical difference (p < 0.05; n = 3).