Figures & data
Figure 1 (a) IPF map plotted along the ED of the sample, (b) the corresponding IQ map, and (c) {0001} pole figure of the initial microstructure of the as-extruded AZ31 alloy obtained from an area of 540 × 540 μm with a step size of 0.5 μm at the center of the sample. In (b) black lines indicate the high-angle grain boundary, and no twin boundary was identified.
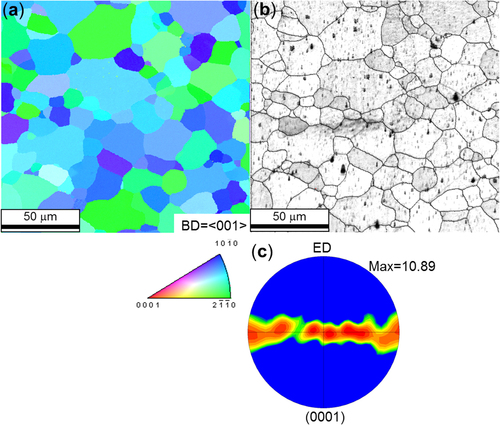
Figure 2 Schematic of the radial compression jig used in this study. ED marks the extrusion direction.
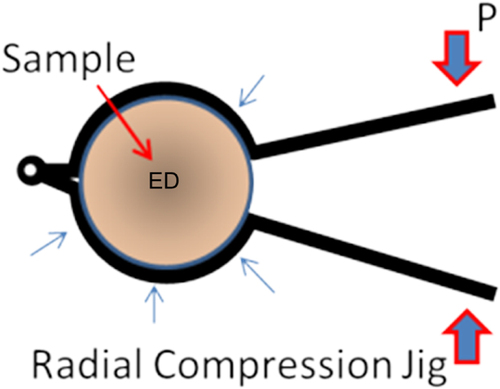
Figure 3 (a), (b) IPF maps plotted along the ED and direction perpendicular to the ED of the sample after application of a radial stress of about 50 MPa at room temperature. (c) Corresponding {0001} pole figure. (d) (0001) pole figure of four numbered grains and their corresponding twins in (b) indicated by arrows from the starting and ending directions of the c-axis during the twinning process.
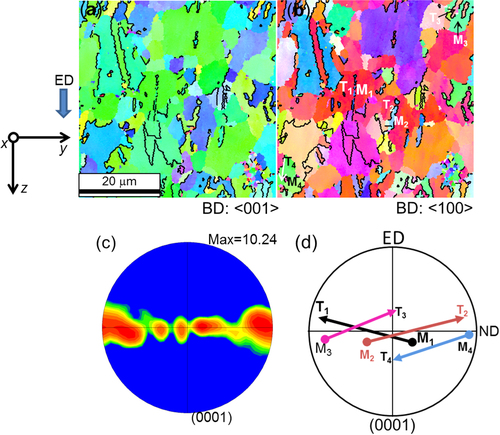
Figure 4 Stress–strain curves of the as-extruded sample and radially compressed sample obtained at 250 °C and strain rates of 20 s−1 and 0.001 s−1, respectively.
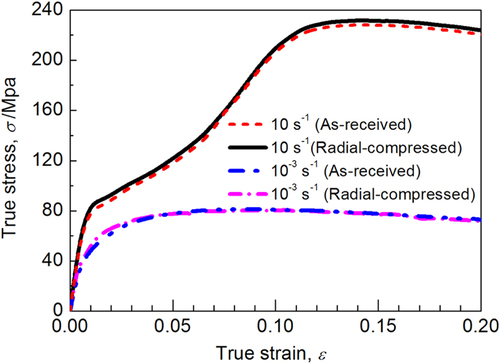
Figure 5 (a) IPF map and (b) corresponding (0001) pole figure of the radially compressed sample after hot compression at 250 °C and 10 s−1 to a true strain of 0.02.
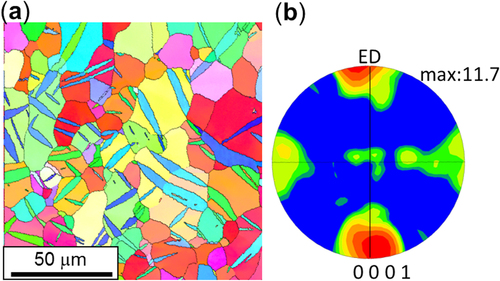
Figure 6 IPF maps of the radially compressed sample after hot compression at 250 °C and 10−3 s−1 to true strains of (a) 0.02, (b) 0.04, and (c) 0.08.
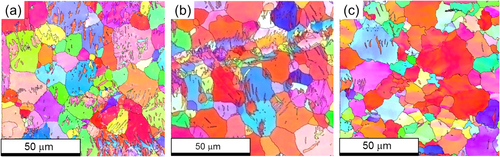
Figure 7 (0001) pole figures corresponding to the IPF maps of figure of the radially compressed sample after hot compression at 250 °C and 10−3 s−1 to true strains of (a) 0.02, (b) 0.04, and (c) 0.08.
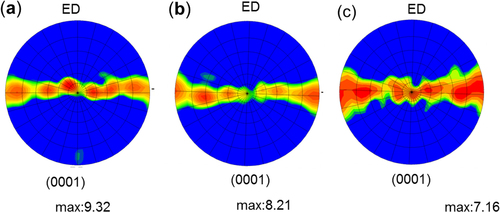
Figure 8 Misorientation angle distributions of the radially compressed sample after hot compression at 250 °C and 10−3 s−1 to true strains of 0.02, 0.04, and 0.08, in which two prominent peaks at 5°–7° and 86°–88° are clearly seen. These peaks share the same rotation axis, <2-1-10>, as shown by the rotation axis distributions of the boundaries of the peaks in the insets.
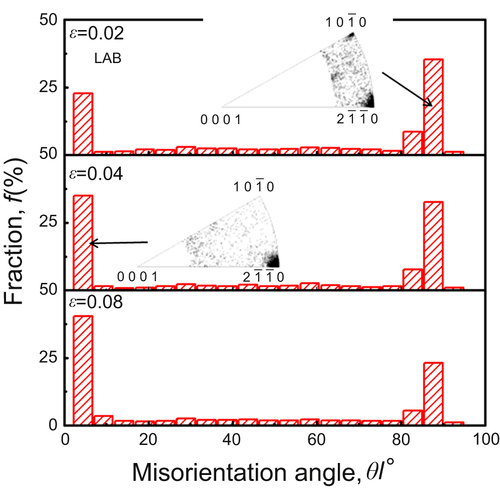
Figure 9 (a) IPF map in the plane perpendicular to the ED of the sample after hot compression at 250 °C and 10−3 s−1 to ∊ = 0.02, where the black and white lines represent the {10-12} twin boundary and LABs (5°–7°), respectively. (b) IQ map clearly showing the twin traces after detwinning, in which the red line represents the {10-12} twin boundary. (c) Point-to-point misorientation profiles along the straight line in (b), indicating that most of the twinning trace had misorientation angles of 5°–7°. (d) Misorientation angle distribution of (a), showing misorientation axis distributions with peaks at 5°–7° and 86°–88° that share the same rotation axis of <2-1-10>.
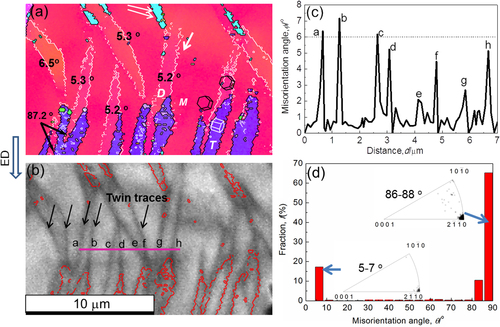
Figure 10 (a) Two possible ways the c-axis can rotate during detwinning in a double twinning process in the interior of an existing twin. (b) Schematic figure showing the detwinning traces and a typical geometry of the residual twin at elevated temperature. (c)–(e) Schematic diagrams showing the grain rotations due to twinning during the radial compression (from (c) to (d)) and the subsequent detwinning process (from (d) to (e)) with the same twinning variant. In planes (c) and (d) the shear direction was indicated by a red solid arrow, and both the radial compression and the subsequent hot compression process were all indicated by open arrows; the rotation axis of the lattice during the twinning process is indicated by a dash-dotted line.
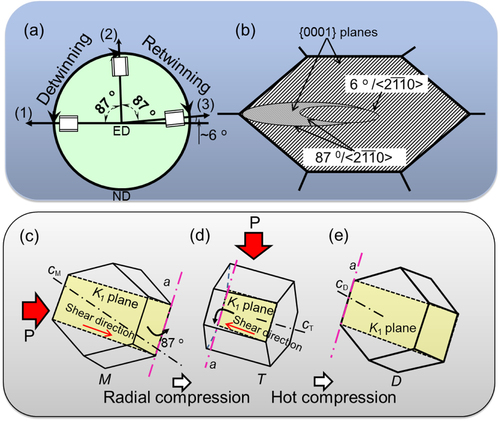
Table 1 Schmidt factors of several deformation modes calculated in the M, T, and D regions marked in figure (a) and the corresponding critical resolved shear stresses.
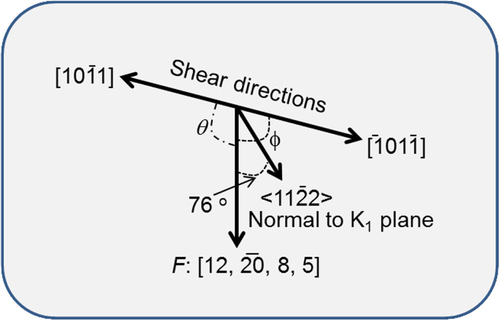
Figure 11 Relation between the loading direction and the detwinning variants for both the (2) to (1) and (2) to (3) routes.