Figures & data
Table 1 Physical and mechanical properties of GFRP prepregs, A2017 and VGCF.
Figure 1 Schematic illustration of the specimen fabrication process.
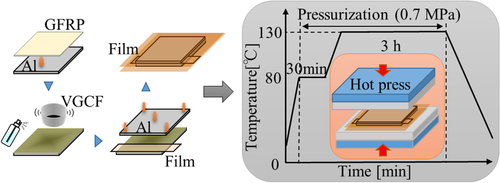
Figure 2 Surface morphology of the aluminum layers. (a) Before acid etching treatment; (b) after acid etching treatment.
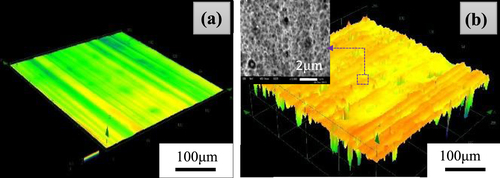
Figure 3 Specimen for ENF tests (length U = 140 mm; width B = 20 mm; height H = 4.34 mm; L = 50 mm; initial crack length a = 40 mm).
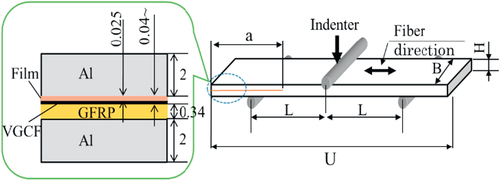
Figure 4 Typical load-displacement curves for all kinds of (a) 0° GFRP/Al laminates; (b) 90° GFRP/Al laminates.
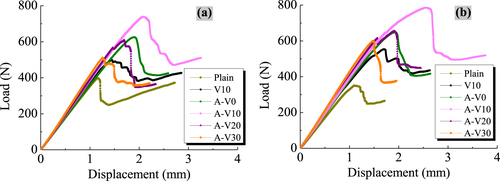
Figure 5 Critical loads of various GFRP/Al laminates.
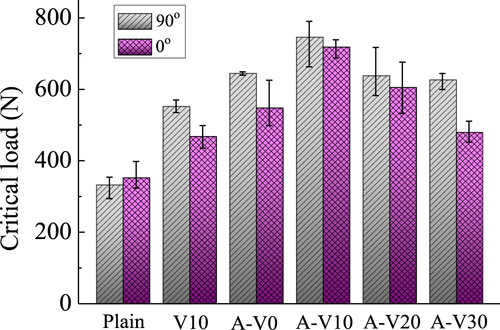
Figure 6 Fracture toughness at crack growth for various GFRP/Al laminates.
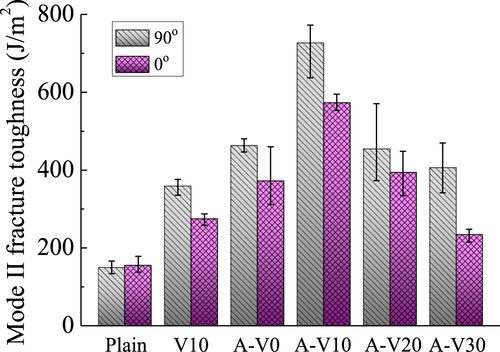
Figure 7 Increasing ratios of critical load and fracture toughness for all kinds of specimens. (Increasing ratio: (PIncreased−PPlain)/P Plain, ‘P’ denotes GIIC or critical load, ‘Increased’ denotes samples of acid treatment or VGCF addition, and ‘Plain’ denotes pristine samples.)
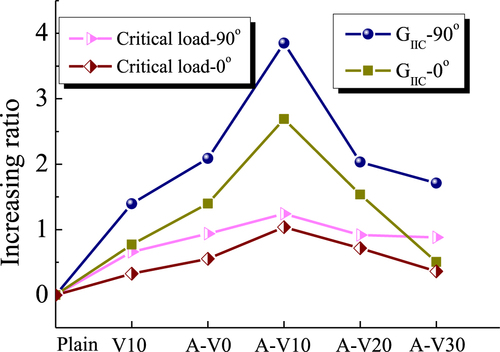
Figure 8 Difference ratios of critical load and fracture toughness of 90° specimens compared to 0° specimens. (Difference ratio: (P90°−P0°)/P0°, ‘P’ denotes G IIC or critical load, ‘90°’ denotes 90° samples, and ‘0°’ denotes 0° samples.)
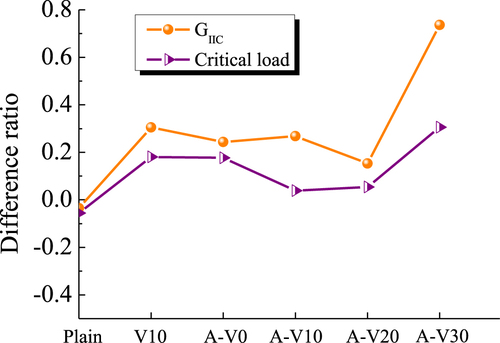
Table 2 Material properties of cohesive element.
Figure 9 Numerical and experimental load-displacement curves for (a) Plain-0° and V10-0° specimens; (b) Plain-90° and V10-90° specimens.
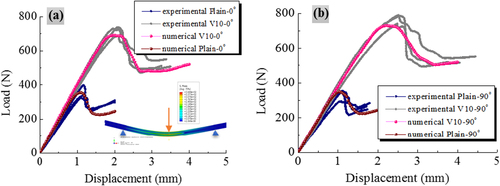
Figure 10 Crack propagation of all kinds of GFRP/Al laminates (a) Plain; (b) V10; (c) A-V0; (d) A-V10; (e) V20; (f) A-V30.
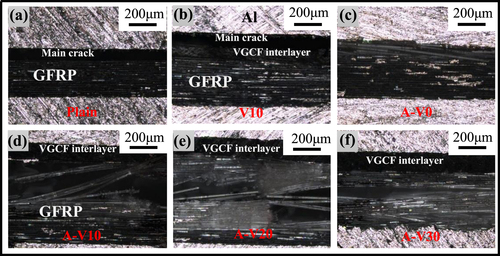
Figure 11 Fracture surface observation of all kinds of GFRP/Al laminates (a) Plain; (b) V10; (c) A-V0; (d) A-V10; (e) A-V20; (f) A-V30.
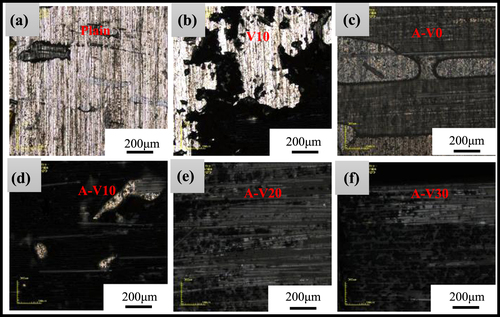
Figure 12 SEM images of fracture surface (a) A-V10; (b) A-V20; (c) A-V30.
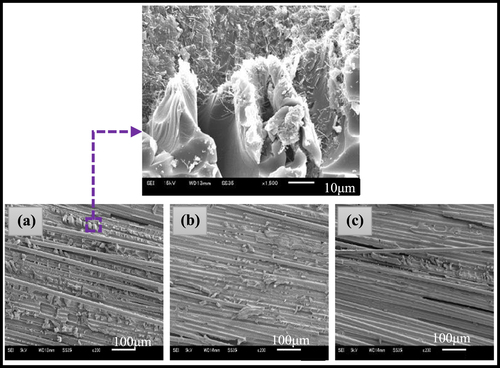
Figure 13 VGCF dispersion condition (a) A-V10; (b) A-V20; (c) A-V30.
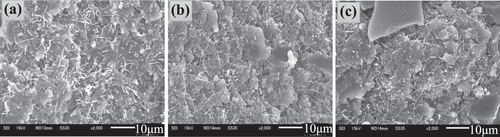
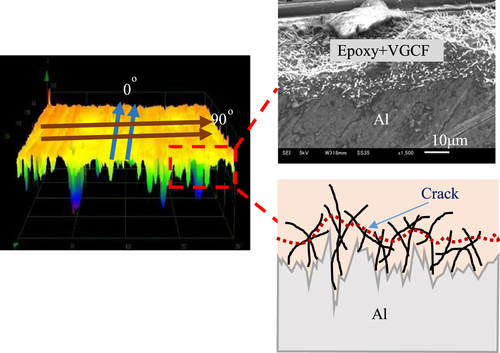
Figure 14 Schematic illustration of the toughening mechanism of the rolling stripes.