
Figures & data
Figure 1 TEM images of N-OMC taken (a) along and (b) perpendicular to the channel direction, (c) EDX graph of N-OMC, (d) XRD spectrum of N-OMC, and (e) nitrogen adsorption–desorption isotherm of N-OMC. Inset of figure (d): wide angle XRD patterns of OMC (A) and N-OMC (B).
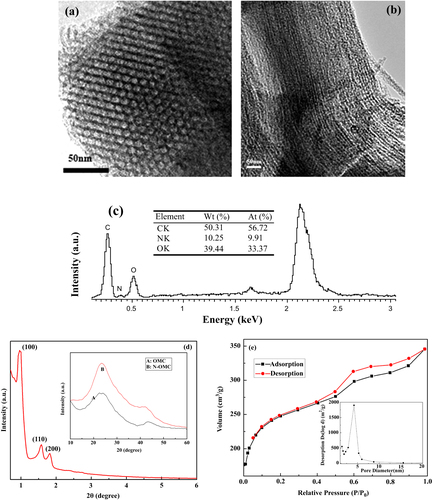
Table 1 Surface area and pore structure parameters of N-OMC.
Figure 2 XPS spectra of the N-OMC (a), N1s (b) and C1s (c) of N-OMC.
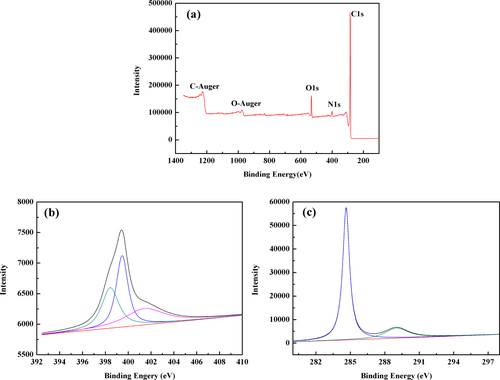
Figure 3 Nyquist plots of N-OMC/PVA/Lac/Au, OMC/PVA/Lac/Au and bare Au electrode (inset) in 5 mM K3[Fe(CN)6]/K4[Fe(CN)6]/0.1 M KCl solution.
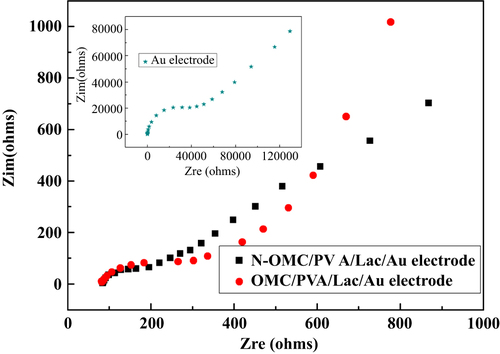
Figure 4 (a) CV plots of N-OMC/PVA/Lac/Au (A), OMC/PVA/Lac/Au (B) and N-OMC/PVA/Au (C) electrodes in 0.1 M PBS (pH 5.0) containing 0.05 mM catechol. (b) Current versus the square root of scan rate plots of N-OMC/PVA/Lac/Au electrode in 0.1 M PBS (pH 5.0) containing 0.05 mM catechol. Inset of figure (b): CV plots of the N-OMC/PVA/Lac/Au electrode in 0.1 M PBS (pH 5.0) containing 0.05 mM catechol at different scan rates from inner to outer: 10, 30, 50, 80, and 100 mV*s−1. (c) Calibration plot of pH vs potential. Inset of figure (c): CV plots of the N-OMC/PVA/Lac/Au electrode in 0.1 M PBS (pH 5.0) containing 0.05 mM catechol (pH: 4, 5, 6, 7 and 8).
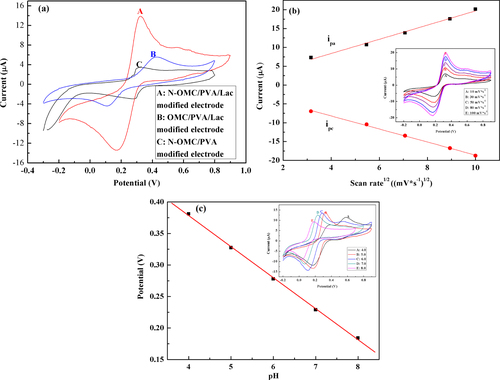
Figure 5 (a) Effect of applied potential on current response of the N-OMC/PVA/Lac/Au electrode to 0.05 mM catechol in 5.0 PBS. (b) Effect of pH of PBS on current response of the N-OMC/PVA/Lac/Au electrode to 0.05 mM catechol at 0.45 V (vs SCE). pH of PBS: 4.0, 5.0, 6.0, 7.0, 8.0. (c) Effect of temperature on current response of the N-OMC/PVA/Lac/Au electrode to 0.05 mM catechol in 5.0 PBS at 0.45 V (vs SCE).
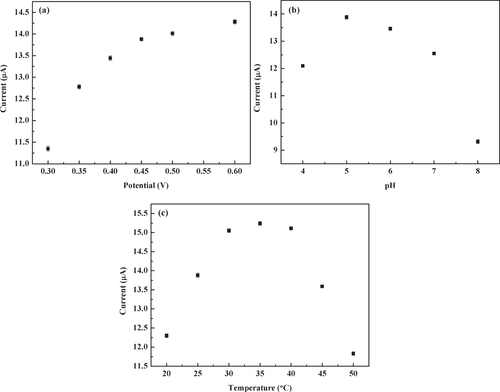
Figure 6 (a) The calibration curves of the N-OMC/PVA/Lac/Au electrode (A) and OMC/PVA/Lac/Au electrode (B) at 0.45 V (vs SCE). Inset: Amperometric responses of the N-OMC/PVA/Lac/Au electrode (A) and OMC/PVA/Lac/Au electrode (B) on successive additions obtained upon the successive addition of 0.5 mM catechol to stirred blank pH 5.0 PBS at 0.45 V (vs SCE). (b) The Lineweaver-Burk curves of the N-OMC/PVA/Lac/Au electrode (A) and OMC/PVA/Lac/Au electrode (B) at 0.45 V (vs SCE).
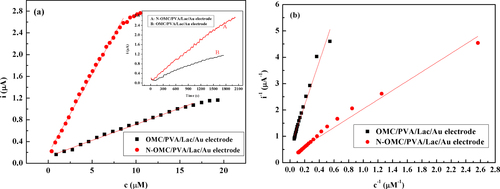
Table 2 Analytical parameters obtained at different laccase biosensors.
Table 3 Determination of catechol (mg l−l) in wine from Grace Vineyard using a standard method and the proposed biosensor.