Figures & data
Figure 1 Schematic of friction stir processing (FSP). The underlying material is subjected to high strain during FSP resulting in fragmentation and homogeneous distribution of the dendrites. The inset shows the actual image of the nugget zone of friction stir processed metallic glass. The highly strained material in the nugget zone comprises fine dendrites compared to elongated ones in the un-deformed region. All samples for thermal analysis and nano-indentation were taken from the center of the nugget zone to eliminate any non-uniformity and edge effects.
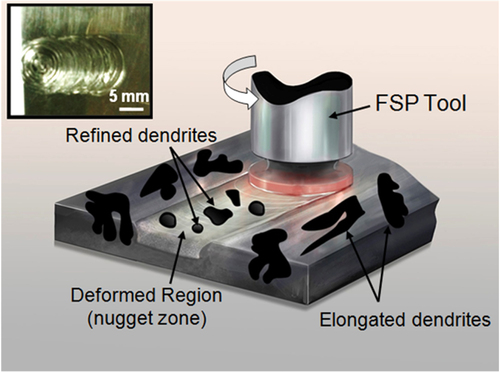
Figure 2 (a) Low magnification and (b) high magnification back-scattered SEM images of as-cast metallic glass composite, Ti48Zr20V12Cu5Be15; (c) low magnification and (d) high magnification back-scattered SEM images of metallic glass composite friction stir processed at 500 rpm (FSP 500); (e) low magnification and (f) high magnification back-scattered SEM images of metallic glass composite friction stir processed at 900 rpm (FSP 900). The composite microstructure comprise ductile dendritic phase distributed in the amorphous matrix. The dendrites get fragmented during friction stir processing and are more uniformly distributed in the amorphous matrix.
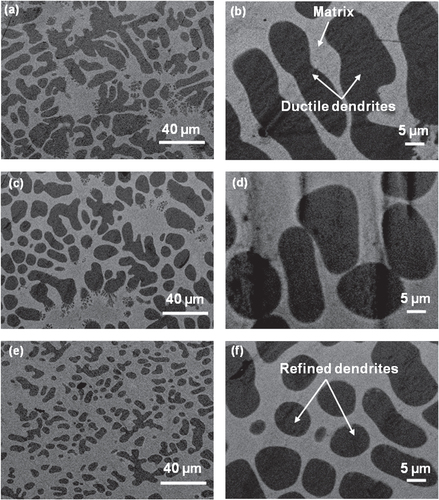
Figure 3 (a) SEM cross-section image of metallic glass composite friction stir processed at 900 rpm (FSP 900); (b) dendrite size distribution and particle circularity along the cross-section as a function of distance from the top surface. The dendrites are finer near the top surface and increase almost linearly with depth upto the plunge depth of the FSP tool. The circularity of particles also increases after friction stir processing due to their fragmentation. The solid symbols represent the data points, while the connecting lines help in reading the trend.
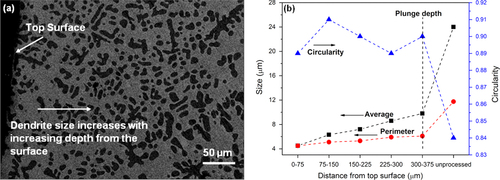
Figure 4 (a) DSC curves for the as-cast metallic glass composite, metallic glass composite friction stir processed at 500 rpm (FSP 500), and at 900 rpm (FSP 900); (b) HRTEM images for matrix of the as-cast metallic glass composite, FSP 500 and FSP 900 specimens. As-cast metallic glass composite as well as the processed specimens show two crystallization peaks. Glass transition temperature and crystallization temperature are indicated by T g and T x respectively. Matrix of as-cast metallic glass composite has a fully amorphous structure, whereas nano-crystallites can be seen in processed specimens indicating partial devitrification. The lines indicate the directionality.
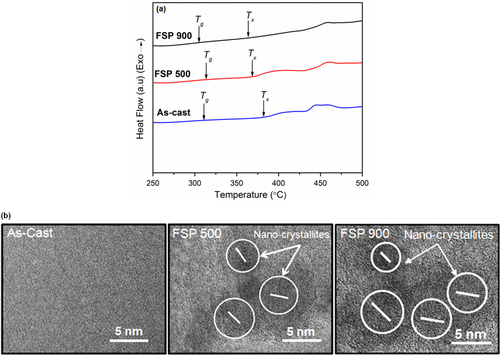
Table 1 DSC analysis comprising glass transition temperature (T g ), crystallization temperature (T x ), and crystallization enthalpy (ΔH) for as-cast metallic glass composite (as-cast), metallic glass composite friction stir processed at 500 rpm (FSP 500), and 900 rpm (FSP 900).
Figure 5 (a) Load-displacement curves for the matrix and dendritic phase in the as-cast metallic glass composite and FSP 500 specimens; (b) curve fitting for the unloading part of the load-displacement curve for the matrix as well as dendritic phase of the as-cast and FSP 500 specimens; (c) hardness variation for the matrix and ductile phase of as-cast metallic glass composite (as-cast), FSP 500, and FSP 900 specimens. Values for a monolithic metallic glass are also shown. Matrix shows smaller indentation depth indicating higher hardness than the dendritic phase. Matrix as well as dendritic phase in FSP 500 specimen shows higher hardness compared to as-cast metallic glass composite. Monolithic metallic glass as well as metallic glass composite show similar hardness variation at different FSP tool rotational speeds.
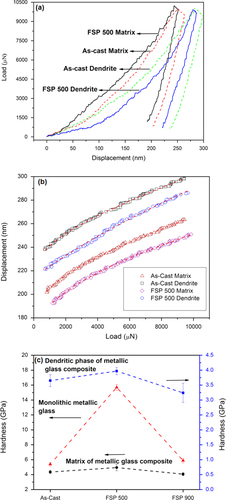
Table 2 Nano-indentation results comprising hardness (H) and modulus values (E) for the matrix and dendrite phase in as-cast metallic glass composite (as-cast), metallic glass composite friction stir processed at 500 rpm (FSP 500), and 900 rpm (FSP 900). The creep-corrected modulus values (Ecorrected) are also given.
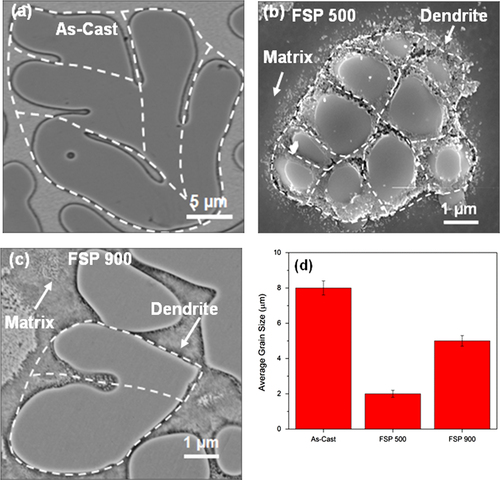
Figure 6 Grain structure and the average grain size for the crystalline dendritic phase of the as-cast composite, FSP 500 and FSP 900 specimens. Grain boundaries, revealed after etching with Kroll’s reagent, are indicated by dotted lines as a guide to the eye.