Figures & data
Figure 1. Chemical structure of polymer fibers used in this work [Citation13–Citation15, Citation17].
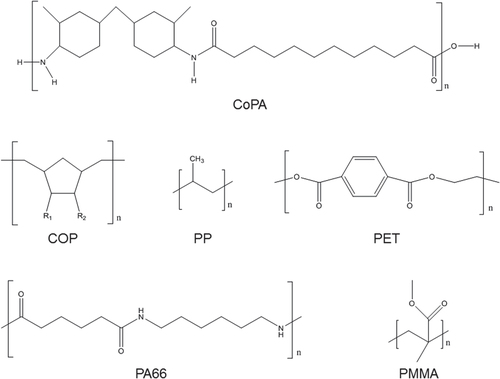
Table 1. Melt spinning parameters and resulting filament tensile characteristics.
Figure 2. Setup for the bending recovery test.
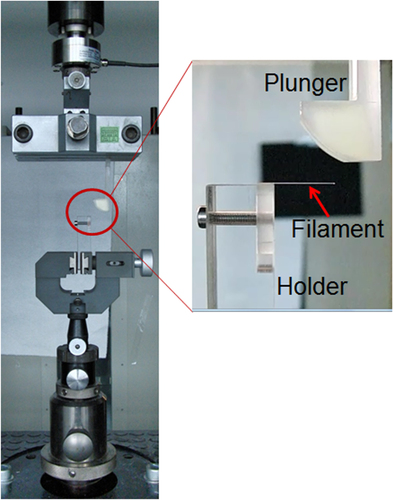
Figure 3. Experimental setup for the single fiber micro-compression test.
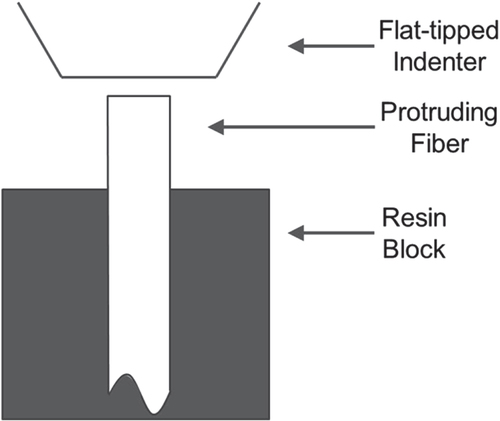
Figure 4. Optical and electron micrographs of COP fiber specimens suitable for axial micro-compression testing before (a) and after (b) dissolution of surrounding PS material.
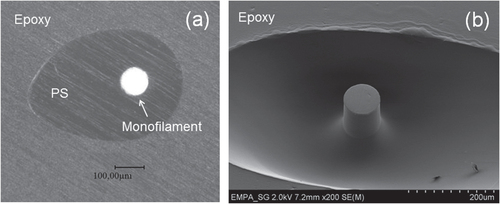
Figure 5. DSC curves of drawn COP (a) and CoPA (b) filaments.
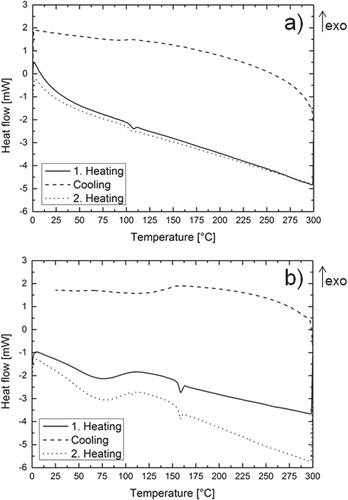
Figure 6. WAXD patterns and 2θ scans after peak-fitting for undrawn and drawn COP filament (a) and drawn CoPA filament (b). The scans were performed with an angular aperture of 10° in meridional and equatorial direction.
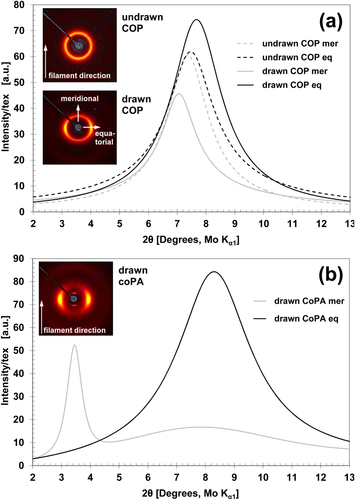
Figure 7. Bending recovery behavior for different melt-spun filaments. Each data point represents the average of three measurements.
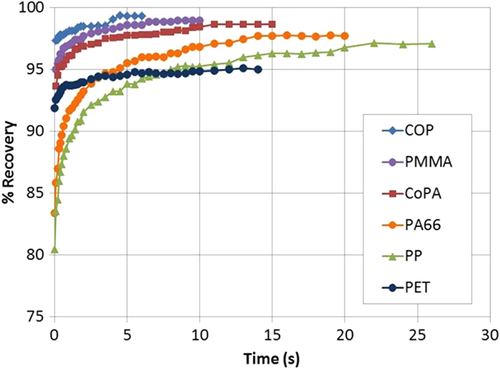
Table 2. Results of bending recovery test for various filaments.
Figure 8. Correlation between final bending recovery and axial tensile modulus for different melt-spun filaments.
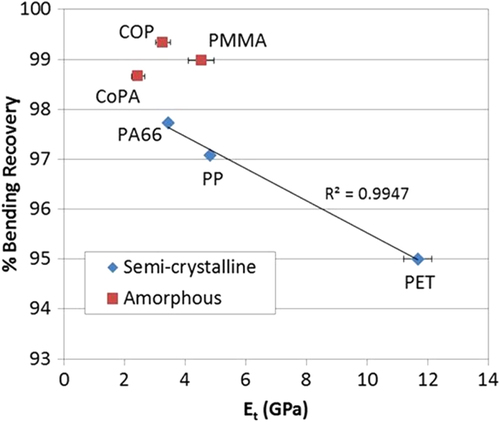
Figure 9. Stress–strain curves in axial compression for different melt-spun monofilaments.
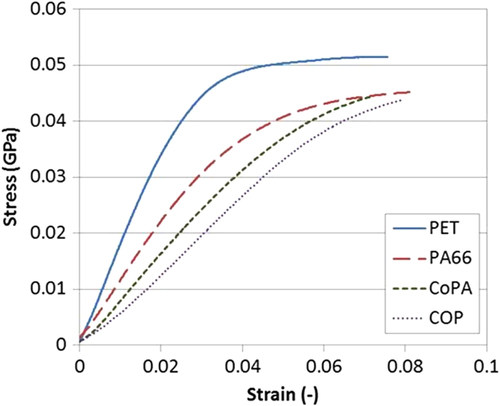
Figure 10. Axial compressive modulus for different melt-spun filaments. E c values are the average of 8 to 12 measurements. Error bars represent the standard deviation.
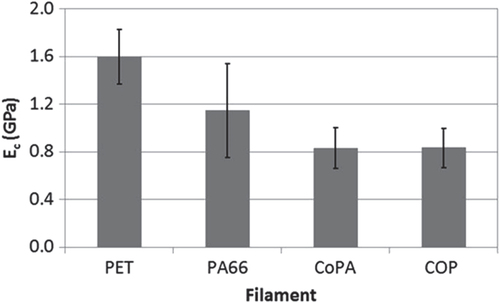
Figure 11. PET filament before (a) and after (b) axial compressive testing, and CoPA filament before (c) and after (d) axial compressive testing.
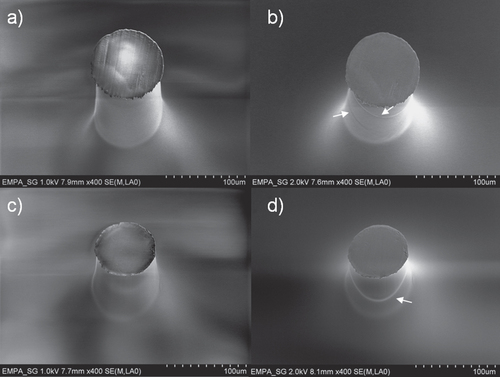
Figure 12. Bent filament during bending recovery testing (a), and strain (ε) and stress (σ) distribution for a fiber of circular cross-section and diameter d, with different modulus in tension and compression (b) [Citation18].
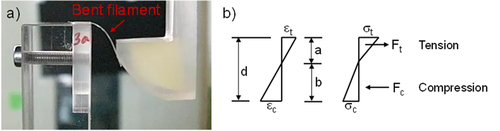
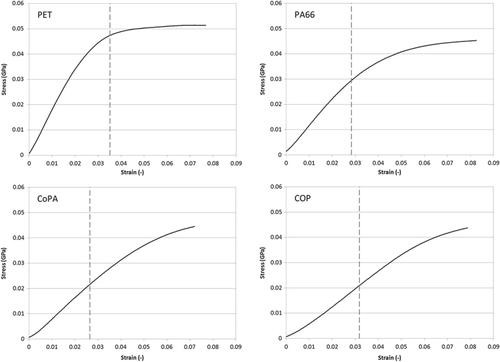
Figure 13. Typical stress–strain curves in axial compression for the monofilaments of interest. The dashed vertical lines indicate the calculated maximum axial compressive strain applied to the filaments with the bending recovery test.