Figures & data
Figure 1. Schematic of the synthetic procedure of the MiMj–Pt core–shell catalyst.
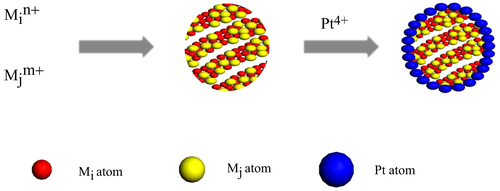
Figure 2. (a) Schematic of the formation of a bimetallic dendritic nanocage with a hollow interior and a porous dendritic wall. (b)–(e) Transmission electron microscopy (TEM) and high-angle annular dark-field scanning TEM (HAADF-STEM) images of dendritic Pt-on-Pd nanoparticles. (b)–(c) Before chemical etching; (d) and (e) after chemical etching [Citation38].
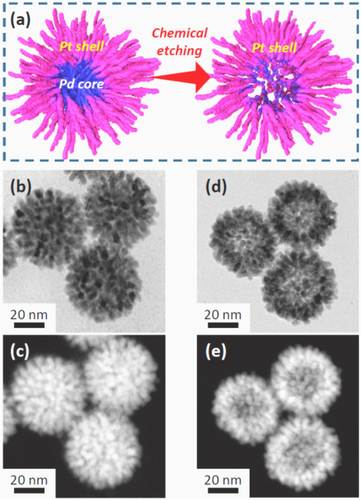
Table 1. The applications, advantages, defects and catalytic activities for the fuel cell of typical precious metal–Pt core–shell catalysts.
Table 2. The applications, advantages, defects and catalytic activities for the fuel cell of typical non-noble metal–Pt core–shell catalysts.
Table 3. Fabrication methods for the Pt-based core–shell catalysts.
Table 4. Features of the core–shell catalysts with precious metal core and silica shell.
Figure 3. Schematic of the synthesis of Pt–mSiO2 nanoparticles. Pt nanoparticles were synthesized using the tetradecyltrimethyl ammonium bromide (TTAB) surfactant as the capping agent, and used as the core particles. Second, as-synthesized Pt–SiO2 particles were prepared by polymerizing TEOS around the TTAB [Citation24]. RT stands for room temperature.
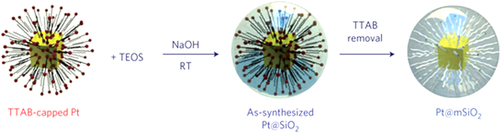
Figure 4. Thermal stability of Pt–mSiO2 nanoparticles. (a)–(d) TEM images of Pt–mSiO2 nanoparticles after calcination at 350 °C (a) and (b), 550 °C (c) and 750 °C (d) [Citation24].
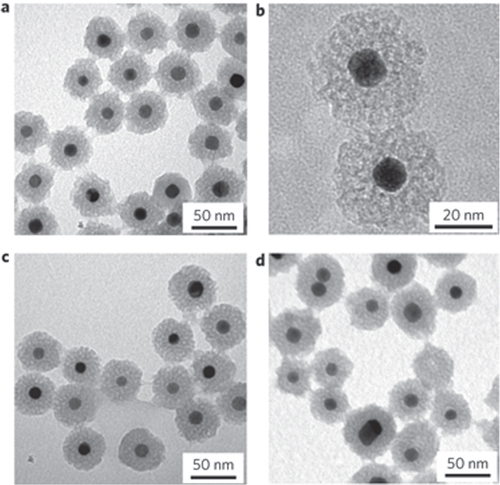
Table 5. Features of typical core–shell catalysts with precious metal core and metal oxide shell.
Figure 5. TEM images of the as-prepared core–shell Au–TiO2 nanoparticles (a) and individual particle image (b). The inset in (a) is the electronic diffraction (ED) pattern of the individual particle. Local HRTEM images of individual TiO2 antenna: root region (c) and external edge of individual antenna (d); the insets in(c) and (d) are their corresponding FFT patterns [Citation174].
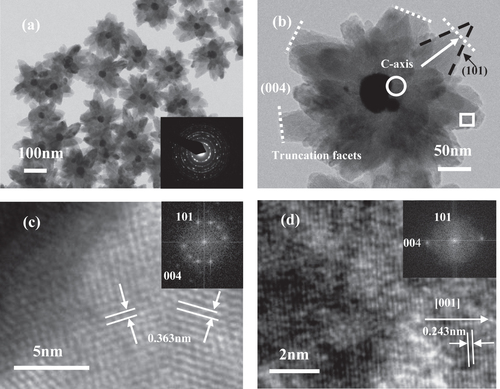
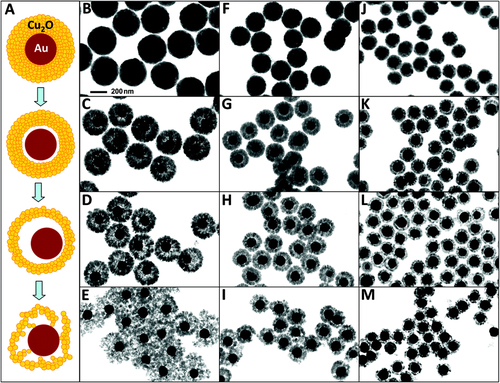
Figure 6. Formation of rattle-like Au–Cu2O yolk–shell nanoparticles. (A) Schematic illustration of the structural evolution of Au–Cu2O core–shell nanoparticles during the hollowing of Cu2O shell. (B)–(M) Bright-field TEM images showing the structural evolution of Au–Cu2O core–shell particles with three different outer radii: particles with an average outer radius of 183 nm obtained at (B) 5, (C) 30, (D) 60, and (E) 90 min; particles with an average outer radius of 130 nm obtained at (F) 5, (G) 20, (H) 40, and (I) 60 min; particles with an average outer radius of 98 nm obtained at (J) 5, (K) 20, (L) 40, and (M) 60 min. The scale of all TEM images is the same as in B [Citation191].