
Figures & data
Figure 1. R sites in the unit cell of the RCd6 cubic approximant to the Tsai-type icosahedral quasicrystals. After [Citation47].
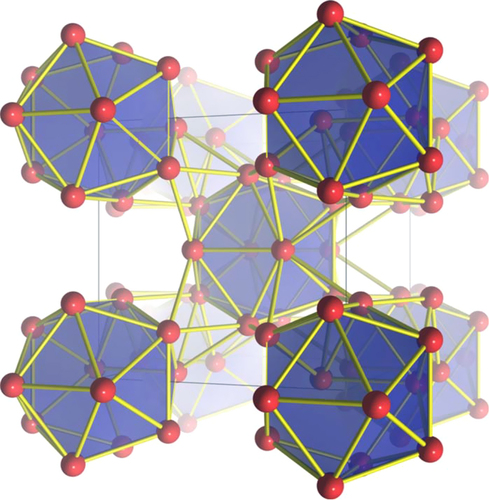
Figure 2. Neutron diffraction from icosahedral Tb-Mg-Zn. The top panel displays the neutron-diffraction data taken at 4 and 30 K on crushed single grains. The data in the bottom panel results from a subtraction (I(4 K)-I(30 K)) of the data from the top panel, emphasizing the onset of short-range magnetic ordering, and the absence of any sharp magnetic component, at low temperature. After [Citation66].
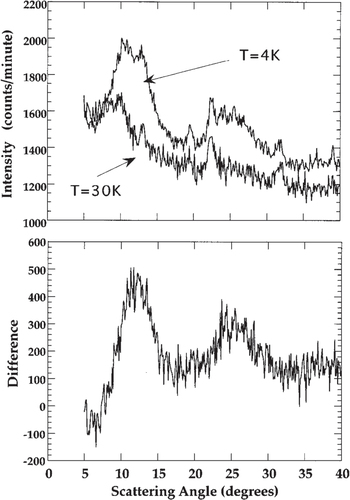
Figure 3. (a) The inverse susceptibility of icosahedral Tb-Mg-Zn, measured in an applied field of 1 kOe. The line depicts the extrapolation of the high-temperature fit to the Curie–Weiss law. The inset shows the angular dependence of the dc magnetization of Tb-Mg-Zn at 10 K () (
= spin freezing temperature) and in an applied field of 55 kOe. (b) The temperature dependence of the dc magnetization of Tb-Mg-Zn in an applied field of 25 Oe, following an initial zero-field-cool or field-cool (labeled in figure). Additional data taken following a field-cool from temperatures less than
(from 2.5, 3.0, 3.5 and 4.0 K) are also shown. After [Citation75].
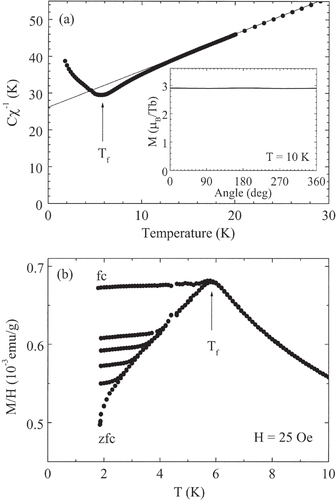
Table 1. Magnetic properties of the ternary R-Mg-Zn and R-Mg-Cd icosahedral quasicrystals. Specific compositions are provided when known. is the measured effective moment per R-ion,
is the calculated free-ion value,
is the measured Weiss temperature, and
and
are the spin freezing temperatures (if observed).
Figure 4. Magnetic-scattering intensity maps at T = 1.6 K for the (a) twofold, (b) threefold, and (c) fivefold planes obtained from the spin-flip scattering of polarized neutrons from icosahedral Ho-Mg-Zn. After [Citation68].
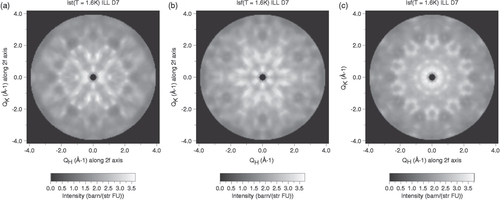
Figure 5.
Q-integrated scattering function, S(), for icosahedral Tb-Mg-Zn at several temperatures. The intensities observed at several angles covering 2
(Q
1.7
at the elastic position) were summed to increase statistics. The solid line represents the vanadium standard spectrum as the instrumental resolution function. Inset: temperature dependence of the integrated intensity for 2
meV. After [Citation83].
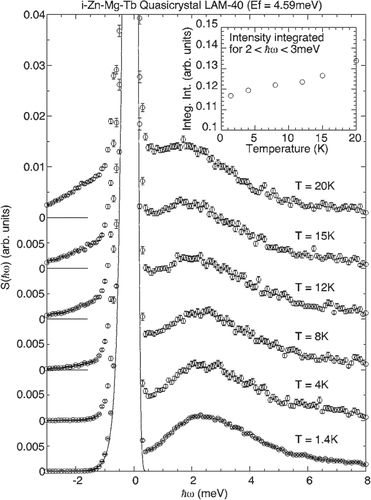
Figure 6. Neutron inelastic scattering spectra of a Ho-Mg-Zn powder sample observed at several temperatures between 1.5 K and 100 K. After [Citation85].
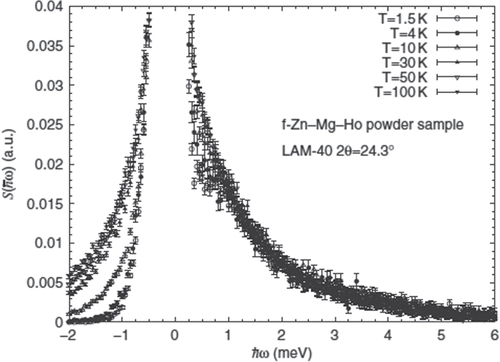
Figure 7. Magnetization curves of the polycrystalline sample of the Tb-Mg-Cd quasicrystal measured under an applied fields of = 10, 300 and 1000 Oe for field cooled (FC) and zero-field-cooled (ZFC) histories. After [Citation77].
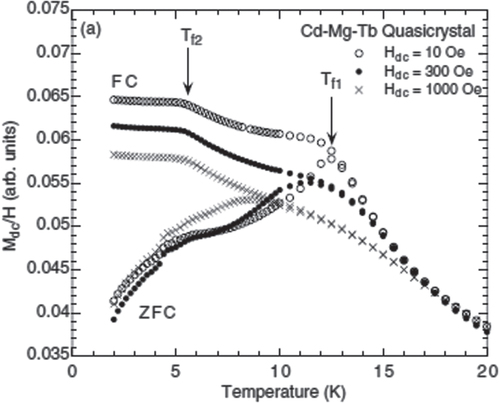
Figure 8. Magnetization curves of single grains of R-Mg-Cd measured under = 100 Oe showing both FC and ZFC behaviors: (a) Gd-Mg-Cd; (b) Tb-Mg-Cd; (c) Dy-Mg-Cd. After [Citation79].
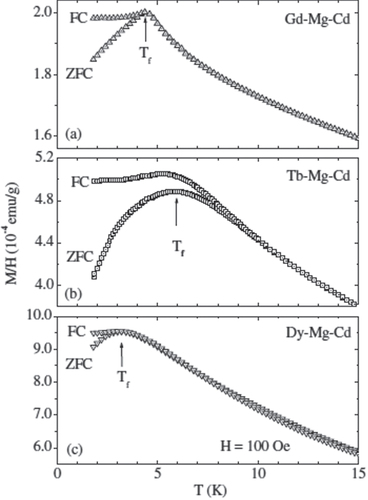
Figure 9. Inverse susceptibility of quasicrystalline Sc16Fe7Zn77 obtained from the temperature dependence of the magnetization measured under a dc external field of 600 Oe. The solid line represents a Curie–Weiss fit in the temperature range 200 T
300 K. Inset: expanded view of the low temperature region (T
20 K) observed under the dc field of 50 Oe. The field-cooled (FC) and zero-field-cooled (ZFC) susceptibilities are shown. After [Citation93].
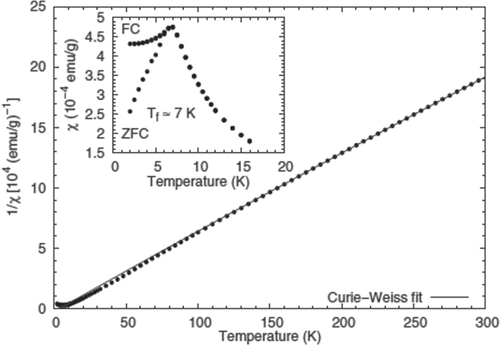
Figure 10. Temperature dependence of the magnetic susceptibility of the Yb-Au-Al quasicrystal and approximant. (a) ac and dc magnetic susceptibility of the quasicrystal measured in a temperature range of 0.08 T
3.0 K (denoted by the lines) and 1.8
T
300 K (circles), respectively. Magnetic fields are described in the figure. The abscissa is plotted on a logarithmic scale. Inset shows the inverse susceptibility
versus
of the approximant (blue circles) and the quasicrystal (red circles) at ambient pressure, and of the quasicrystal at pressures of 0.72 GPa and 1.54 GPa. The black lines are a linear extrapolation to T = 0. (b) Magnetic susceptibility of the approximant measured in the same condition as in panel (a). Insets show the field dependence of the ratio
at T = 0.1 K for the quasicrystal and the approximant, respectively, where
. After [Citation45].
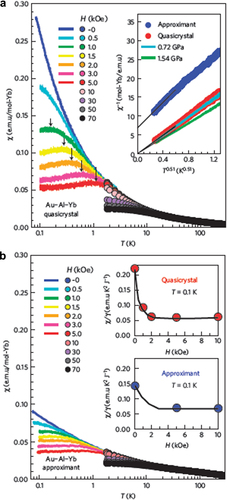
Figure 11. (Top) Magnetic susceptibility of TbCd6 from 1.8 to 300 K measured under a magnetic field of 1000 Oe. The solid line is a fit to the Curie–Weiss law between 50 and 300 K. The inset shows the inverse susceptibility of TbCd6. (Bottom) Magnetic susceptibility of TbCd6 at low-temperature from 1.8 to 30 K measured under a magnetic field of 50 Oe. The curve displays two anomalies at 24 and 2.4 K and a kink at 19 K as denoted by the arrows. FC and ZFC magnetic susceptibilities are shown. After [Citation47].
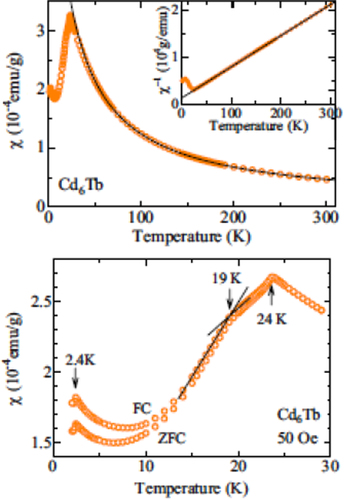
Table 2. Magnetic properties of the binary RCd6 cubic approximants. is the measured effective moment per R-ion,
is the calculated free-ion value,
is the measured Weiss temperature, and
through
refer to temperatures where anomalies in bulk transport and thermodynamic measurements suggest magnetic ordering transitions.
Figure 12. Distribution of charge and magnetic peaks measured by an (a) H scan, (b) K scan, and (c) L scan through the (14 0 0) charge peak position and an (e) H scan, (f) K scan, and (g) L scan through the (15 0 0) magnetic peak position. Panels (d) and (h) plot the charge and magnetic peak positions schematically. After [Citation48].
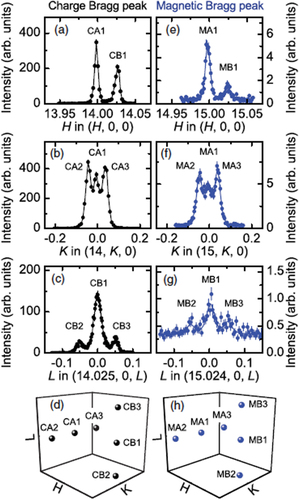
Figure 13. Low-temperature superstructure of RCd6 showing the high-temperature cubic (orange lines) and low-temperature monoclinic (blue lines) unit cells, and the orientational ordering of the Cd tetrahedra within the Tsai clusters. After [Citation58].
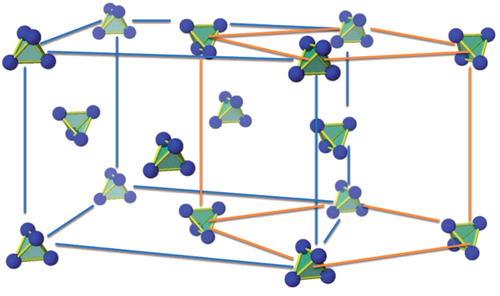
Figure 14. Weiss temperature values versus de Gennes factor. Solid points represent the Weiss temperature, , values for the R-Cd quasicrystals (black circles) obtained in the present measurements from a linear fit of the high-temperature inverse magnetic susceptibility measured at either H = 5000 or 10,000 Oe (shown in the inset). After [Citation46].
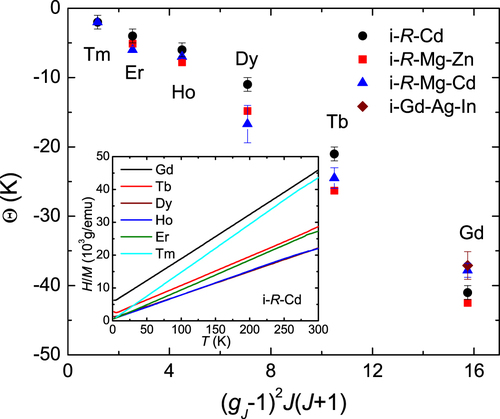
Figure 15. Temperature-dependent FC and ZFC magnetization data measured under a field of 50 Oe from (a) Gd-Cd, (b) Tb-Cd and (c) Dy-Cd. The insets compare the higher-field magnetization data (ZFC) for icosahedral phase samples with their respective RCd6 approximants. The arrows in the insets indicate the location of clear magnetic ordering features for the approximants, which are absent for the related R-Cd quasicrystalline compounds (main figure). After [Citation46].
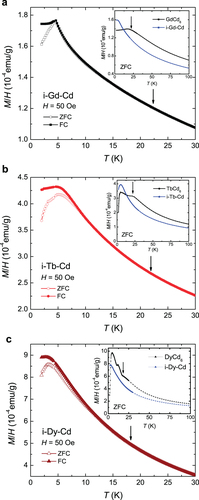
Table 3. Magnetic properties of the binary R-Cd icosahedral quasicrystals. is the measured Weiss temperature and
is the spin freezing temperature determined from the cusp in the zero-field-cooled dc magnetization data. After [Citation46, Citation107].