
Figures & data
Figure 1. Characteristic features and potential applications of Al- and B-based icosahedral cluster solids (ICS).
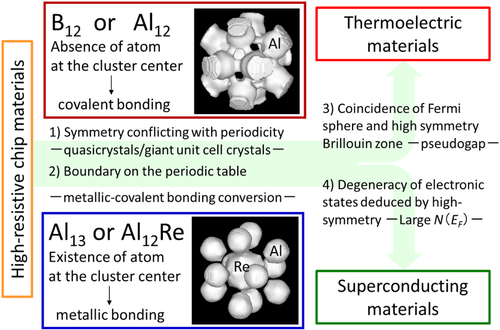
Table 1. Comparison between structurally simple and complex solids.
Figure 2. Icosahedral cluster solids (ICS) as structurally complex solids.
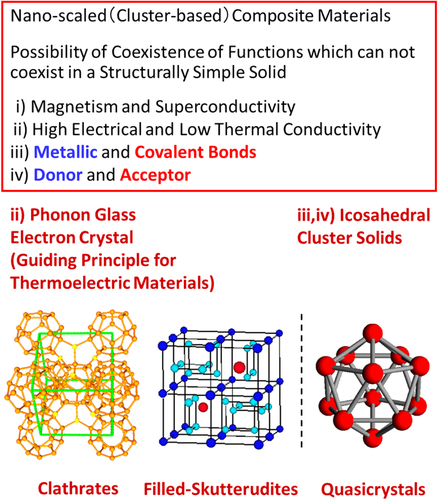
Table 2. Comparison between (a) the metal–insulator transition and (b) metallic–covalent bonding conversion.
Figure 3. Equidensity surfaces (0.25–0.40 e Å−3) of the electron density for (a) Si (covalent bonding nature) and (b) Al (metallic bonding nature).
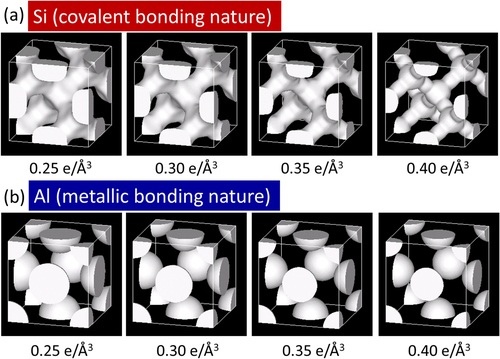
Figure 4. Equidensity surfaces (0.25–0.40 e Å−3) of the electron density for icosahedral clusters of (a) the 1/1-AlReSi approximant and (b) the 1/0-Al12Re approximant [Citation13].
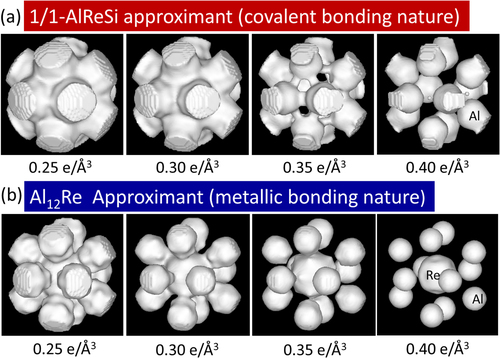
Figure 5. (a) Equidensity surfaces (0.35 e Å−3) of the electron density of the first- and second-shell clusters and (b) electron density at the bond midpoint in the 1/1-AlReSi approximant, together with the data of 1/0-Al12Re, and pure Si and Al [Citation13].
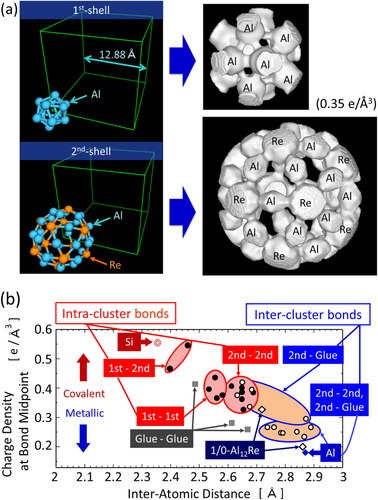
Figure 6. Bonding nature of the first-shell Al icosahedral cluster and the electronic density of states of (a) 1/1-AlReSi and (b) 1/0-Al12Re approximants. (c) The temperature dependence of the electrical resistivity of the icosahedral Al–Pd–Re quasicrystal, and 1/1-AlReSi, 1/1-AlMnSi, and 1/0-Al12Re approximants.
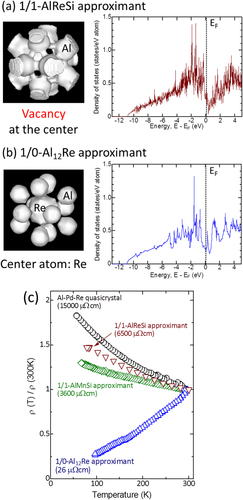
Table 3. Minimum electronic density of states near E F and calculated density of states at E F using the free electron model for 1/1-AlReSi and 1/0-Al12Re approximants.
Figure 7. (a) Main building block, Mackay icosahedral (MI) clusters, and glue atoms (magenta atoms) in Al-based icosahedral approximants and quasicrystals. (b) Diagram of the guiding principle of weakly bonded rigid heavy clusters (WBRHCs). The effective mass (m*) increases by weakening of inter-cluster bonds (V o) or strengthening of intra-cluster bonds (V i). The composition dependences of the effective mass ratio ((c) and (d)) and the maximum dimensionless figure of merit ((e) and (f)) for Al–Pd–Re ((c) and (e)) and Al71Pd20(Re1 − x Ru x )9 ((d) and (f)) quasicrystals. m e* and m h* are the effective masses of the electron and hole, respectively, obtained from fitting the data in figure by the two-band model, and m e is the electron mass in vacuum. e/a is the mean number of valence electrons per atom ratio, and decreases with increasing transition metal concentration. The letters A, B, C, and D in (b)–(f) correspond to each other [Citation53].
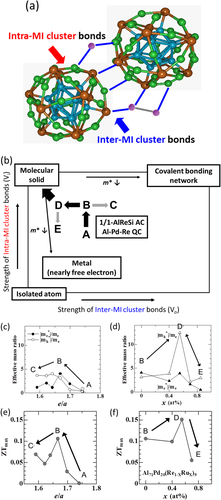
Figure 8. Temperature dependence of (a) electrical conductivity and (b) Seebeck coefficient for Al71Pd20(Re1 − xRux)9. The solid lines are fitted curves obtained using the two-band model [Citation53].
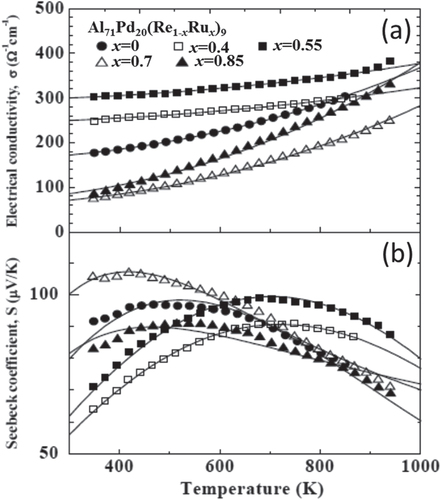
Figure 9. Transition metal elements that are candidates for substitution in the Al–Pd–Re quasicrystal. The bond strength will decrease with decreasing atomic number in congener. Route (1) is Ru and Fe substitution in the Re site, and route (2) is full replacement of Mn in Re sites.
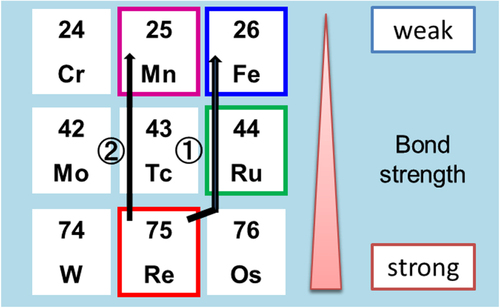
Figure 10. Dimensionless figure of merit (ZT) as a function of temperature for (a) Al71Pd20(Re1 − xRux)9 (x = 0, 0.4, 0.55, 0.7) [Citation53], (b) Al71Pd20(Re1 − xFex)9 (x = 0, 0.2, 0.4, 0.65) [Citation54], and (c) Al71Pd20(Mn, Re)9 [Citation55] quasicrystals.
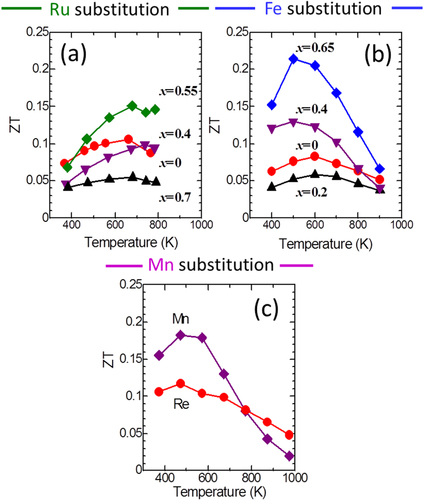
Figure 11. (a) Typical example of the porous microstructure in arc-melted and annealed Al–Pd–Re quasicrystal. The black area represents macroscopic pores and/or cracks. (b) That of the dense microstructure in SPS sintered one. The magnifications are the same for (a) and (b).
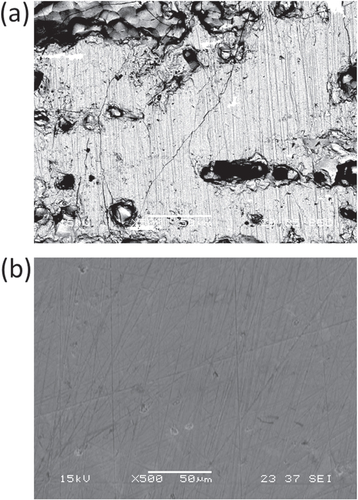
Figure 12. (a) Ga substitution of Al sites in the Al–Pd–Mn quasicrystal to weaken the inter-cluster bonds. (b) The thermal conductivity (κ) and (c) the dimensionless figure of merit (ZT) as a function of temperature for Al71 − xGaxPd20Mn9 (x = 0, 2, 3) [Citation56].
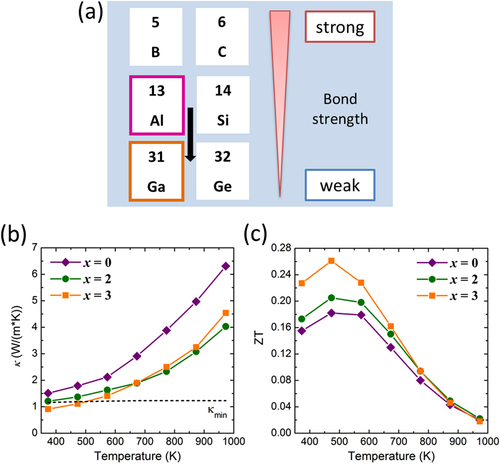
Figure 13. Electronic density of states (DOS) for Al–(Ga)–Pd–Mn quasicrystals using the Quandt–Elser model [Citation57–Citation59]. The inset shows the DOS in the vicinity of the Fermi energy.
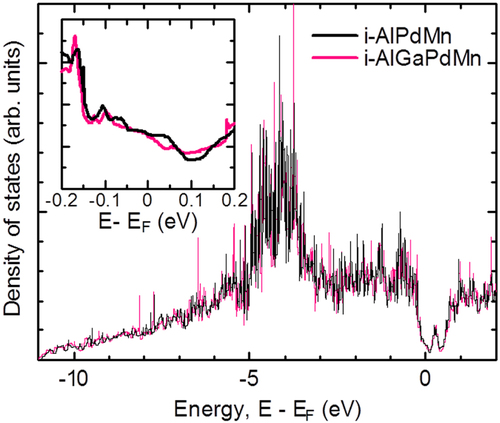
Table 4. Average speed of sound (vs), Debye temperature (θD), relative change in the relaxation time of the phonon (Δτp/τp), and phonon thermal conductivity (κp) for Al71 − xGaxPd20Mn9 quasicrystals (x = 0, 2, 3) at room temperature [Citation55].