Figures & data
Figure 1. (a) Absorption spectra of the SWCNT-coated dish prepared by spraying 15 (red), 30 (blue) and 65 (green) times. (b)–(d) AFM images of the SWCNT-coated dishes prepared by spraying (b) 15, (c) 30 and (d) 65 times. Scale bar: 2 μm.
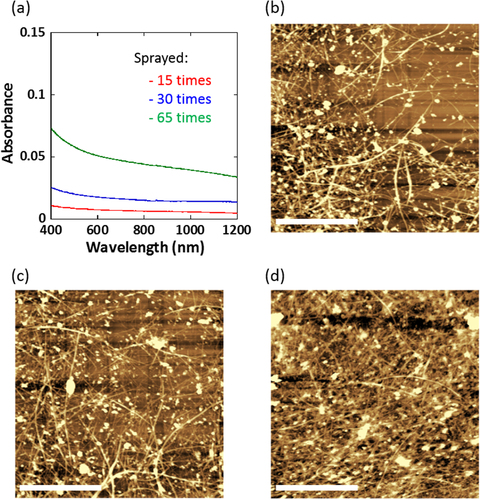
Figure 2. (a) Optical microscopy images of the cells cultured on the SWCNT-coated dish with a resistivity of 1 × 10⁴ Ω sq−1 before (upper) and after (lower) the irradiation using an objective lens of 60×. The cell after the irradiation shows membrane blebbing as indicated by the white arrow. Scale bar: 10 μm. (b) Plots of the minimum laser energy leading to blebbing depending on laser spot diameter for SWCNT thin films of 1 × 10⁵ (red), 1 × 10⁴ (blue) and 3 × 10³ (green) Ω sq−1 on each dish.
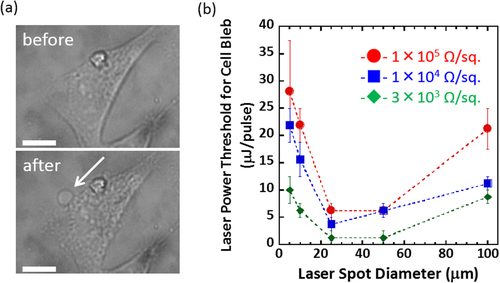
Figure 3. (a) Experimental setup of single cell measurements using a multichannel spectrophotometer. (b) Plots of the normalized fluorescence intensity of calcein-AM in the cells upon irradiation at 0 (black), 12.5 (red), 15.0 (blue), 17.5 (green), 18.8 (light blue) and 25.0 (orange) μJ/pulse. (c) Fluorescence microscopy images of the HeLa cells monitored at 490 nm (left and middle column) and 530 nm excitation (right column) before (left column) and after irradiation (middle and right column) at 12.5, 15.0, 17.5 and 18.8 μJ/pulse from left to right. Scale bar: 100 μm.
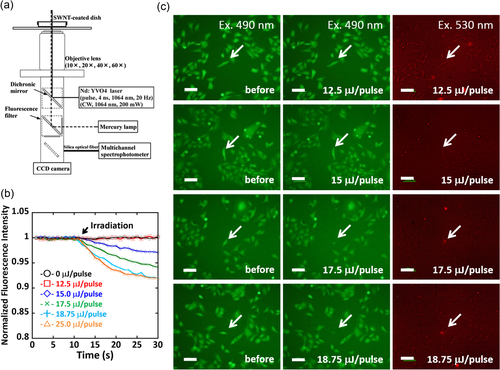
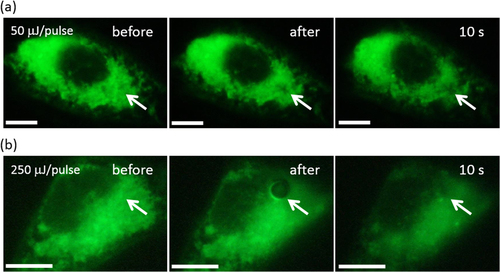
Figure 4. Fluorescence microscopy images of the HeLa cells stained with DiOC6 after irradiation at (a) 50 and (b) 250 μJ/pulse. Scale bar: 10 μm.