Figures & data
Figure 1. PL spectra of NAC-capped ZnCdSe QDs grown at different pH values (λex = 310 nm); the inset shows the QYs of these prepared QDs.
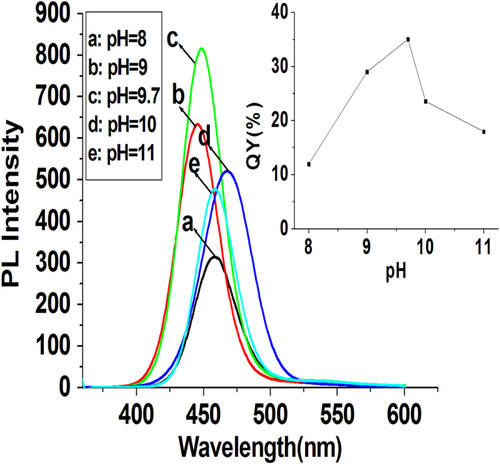
Figure 2. PL spectra of NAC-capped ZnCdSe QDs prepared at various reaction times (50 to 70 min) (λex = 310 nm); the inset shows the QYs of these prepared QDs.
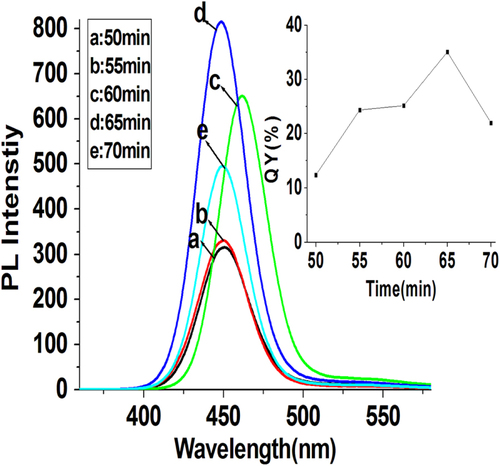
Figure 3. (a) PL spectra and (b) UV-visible absorption spectra of NAC-capped ZnCdSe QDs with different n(NAC)/1(Zn) values (1.2, 2.0, 2.4, 3.0, and 3.6 from a to e) (λex = 310 nm); the inset shows the QYs of these prepared QDs.
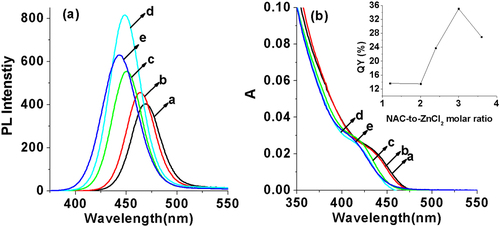
Figure 4. (a) Corrected PL spectra and (b) UV-visible absorption spectra of NAC-capped ZnCdSe QDs with different n(Cd)/1(Zn) values (0.005, 0.01, 0.02, 0.03, and 0.04 from a to e) (λex = 310 nm); the inset shows the PL image of the corresponding ZnCdSe QDs under UV lamp irradiation.
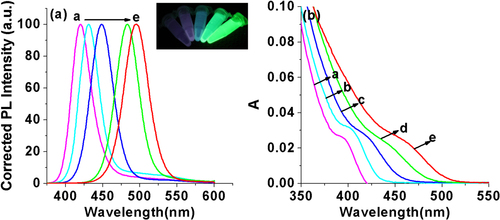
Figure 5. (a) Corrected PL spectra and (b) UV-visible absorption spectra of NAC-capped ZnCdSe QDs with different n(Se)/1(Zn) values (0.03, 0.0 4, 0.05, 0.07, 0.10, and 0.15 from a to f) (λex = 310 nm); the left and the right insets show the PL image of the corresponding ZnCdSe QDs under UV lamp irradiation and the schematic representation of spherical QDs with increasing n(Se)/1(Zn) values respectively.
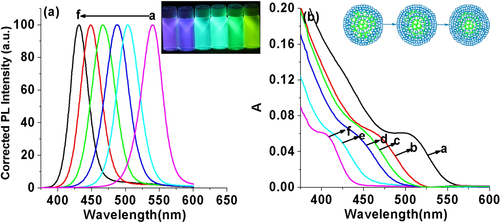
Figure 6. TEM images of a series of NAC-capped ZnCdSe QDs grown at different n(Cd)/1(Zn) values (from (a) to (d): 0.005, 0.02, 0.03 and 0.04). All scale bars are 20 nm.
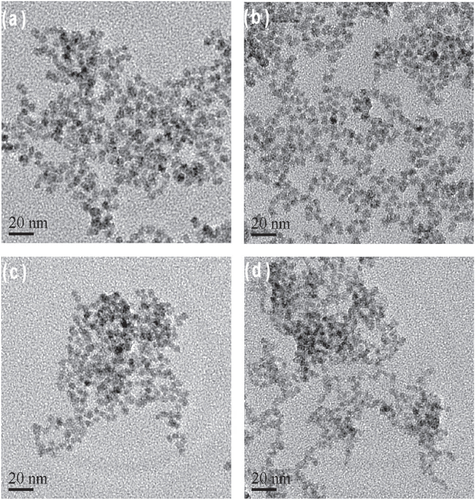
Figure 7. XRD pattern of NAC-capped ZnCdSe QDs reacted for 65 min.
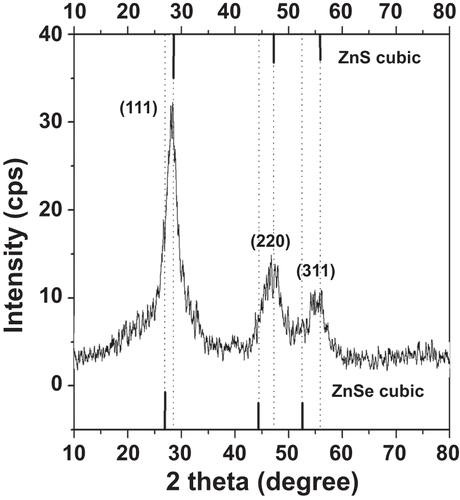
Figure 8. EDS spectrum of NAC-capped ZnCdSe QDs at the molar ratio of Zn:Se:Cd = 1.0:0.1:0.02.
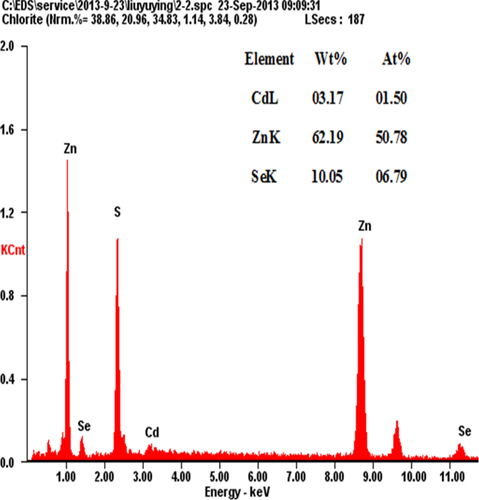
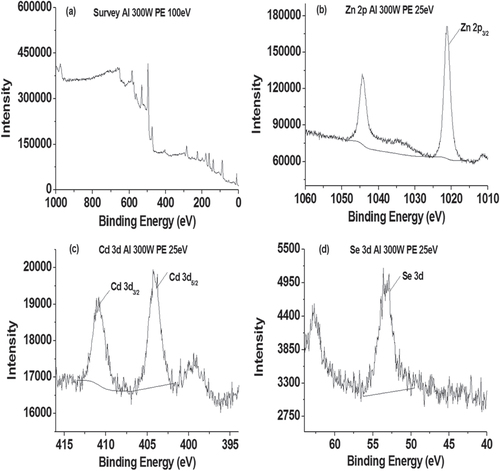
Figure 9. XPS spectra recorded from ZnCdSe QDs (λem = 449 nm): (a) Overview spectrum, (b) Zn (2p), (c) Cd (3d) and (d) Se (3d) peaks.