Figures & data
Figure 1. Time-kill curves for P. gingivalis JCM12257 (a) and A. actinomycetemcomitans JCM8577 (b) following exposure to 0.9% NaCl (control), 0.2% CHX, and NBW3. The number of CFUs/mL of P. gingivalis exposed to 0.2% CHX did not drop to below the lower limit of detection (<10 CFUs mL−1) until 5 min of exposure. In contrast, the number of CFUs/mL of P. gingivalis exposed to NBW3 dropped to below the lower limit of detection (<10 CFUs mL−1) after only 0.5 min of exposure. Also, the number of CFUs/mL of A. actinomycetemcomitans exposed to NBW3 and 0.2% CHX dropped to below the lower limit of detection (<10 CFUs mL−1) after 0.5 min of exposure.
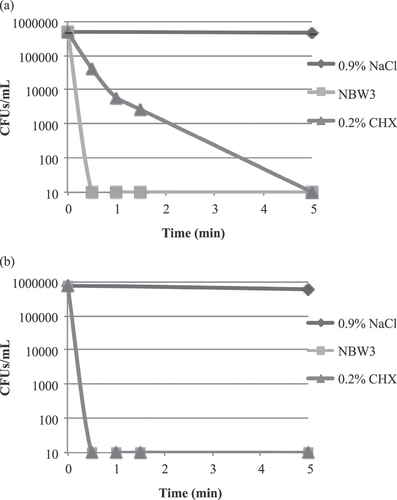
Figure 2. In vitro time-response curves for EpiGIN-100™ (a) and EpiORL-200™ (b) tissues exposed to 1% Triton™ X-100. The exposure time necessary to reduce the viability of tissue cells by 50% (ET50) was 6.8 h for EpiGIN-100™ and 47.1 min for EpiORL-200™ tissues. Data are expressed as the mean ± standard deviation of triplicate determinations. The experiment was performed three times and similar results were obtained in each experiment.
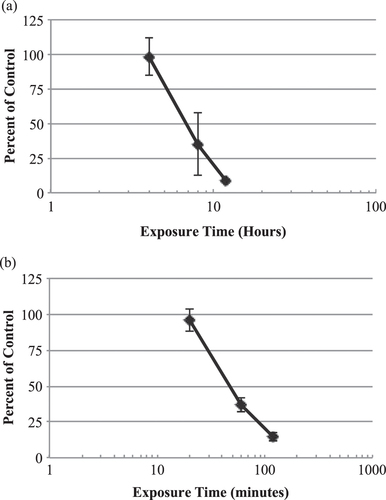
Figure 3. In vitro time-response curves for EpiGIN-100™ (a) and EpiORL-200™ (b) tissues exposed to 0.2% CHX. The exposure time necessary to reduce the viability of tissue cells by 50% (ET50) was 10.8 h for EpiGIN-100™ and 8.4 h for EpiORL-200™ tissues. Data are expressed as the mean ± standard deviation of triplicate determinations. The experiment was performed three times and similar results were obtained in each experiment.
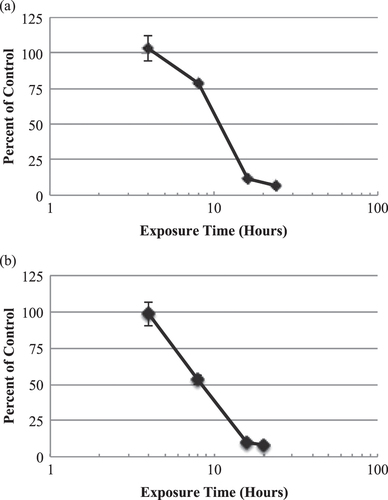
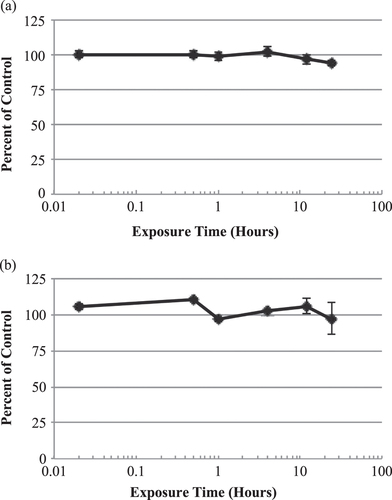
Figure 4. In vitro time-response curves for EpiGIN-100™ (a) and EpiORL-200™ (b) tissues exposed to NBW3. The exposure time necessary to reduce the viability of tissue cells by 50% (ET50) was over 24 h for both EpiGIN-100™ and EpiORL-200™ tissues. Data are expressed as the mean ± standard deviation of triplicate determinations. The experiment was performed three times and similar results were obtained in each experiment.