
Figures & data
Figure 1. Ratio of intensities of emission lines of Ag (328.1 nm) and Ar (420.1 nm) as recorded during sputtering of Ag in Ar/CO2/C2H4 atmosphere (gas flow rates of 50/6/1 sccm, respectively) at a pressure of 5 Pa and various RF powers (a). Time evolution of selected emission lines during deposition at 50 W (b).
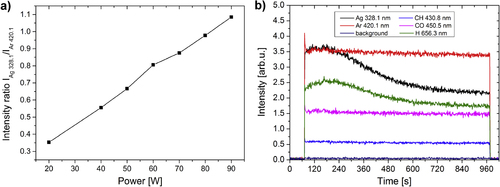
Figure 2. TEM micrographs of Ag/a-C:H:O nanocomposite films deposited at different RF powers (W) as measured right after their deposition. In each case, a bright field image (left) is displayed together with the corresponding dark field image of the same spot (right). For each micrograph, a distribution histogram of equivalent nanoparticle diameters d with its log-normal fit and modal value of nanoparticle diameter (dm) and its standard deviation (σ) are displayed (top). The corresponding histogram of nanoparticle shape factor S and the average value of shape factor (Sa) are displayed (bottom).
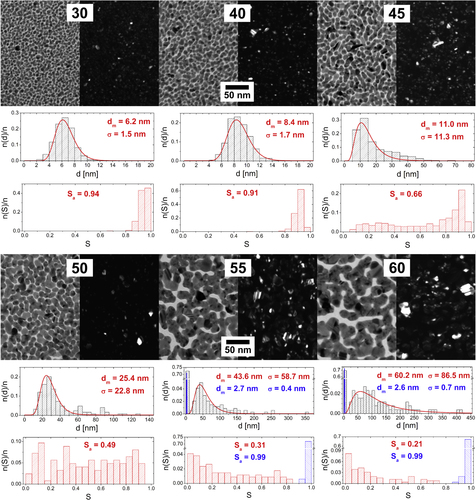
Figure 3. TEM micrographs of Ag/a-C:H:O nanocomposite films deposited at RF power of 30 W (top) and 60 W (bottom) as measured right after the deposition (left), 2 months after the deposition (middle) and 18 months after the deposition (right). In each case, a bright field image (left) is displayed together with the corresponding dark field image of the same spot (right). For each micrograph, a distribution histogram of equivalent nanoparticle diameters d with its log-normal fit and modal value of nanoparticle diameter (dm) and its standard deviation (σ) are displayed (top). The corresponding histogram of nanoparticle shape factor S and the average value of shape factor (Sa) are displayed (bottom).
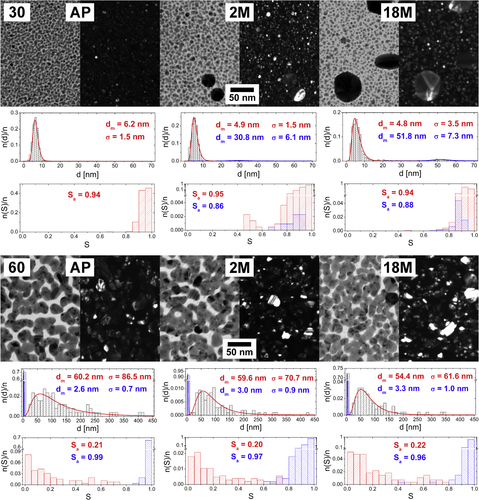
Figure 4. TEM micrographs of Ag/a-C:H:O nanocomposite films deposited at RF power of 30 W (top) and 60 W (bottom) as measured right after the deposition (left), after 1 h in distilled water (middle) and after 1 day in distilled water (right). In each case, a bright field image (left) is displayed together with the corresponding dark field image of the same spot (right). For each micrograph, a distribution histogram of equivalent nanoparticle diameters d with its log-normal fit and modal value of nanoparticle diameter (dm) and its standard deviation (σ) are displayed (top). The corresponding histogram of nanoparticle shape factor S and the average value of shape factor (Sa) are displayed (bottom).
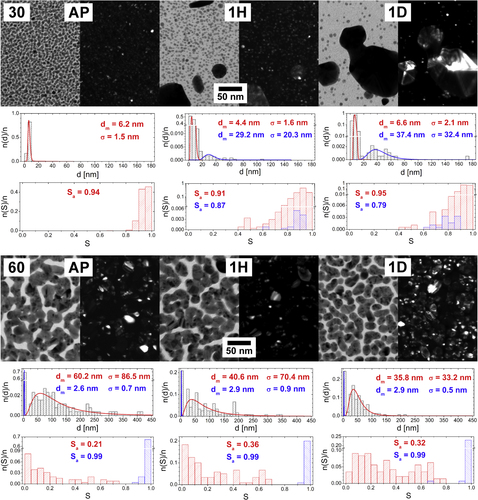
Figure 5. Time evolution of the microstructural parameters of Ag/a-C:H:O nanocomposite films (modal value of equivalent nanoparticle diameter dm, (a) and (d), standard deviation of diameters distribution σ, (b) and (e), and average value of shape factor of nanoparticles Sa, (c) and (f)) deposited at different RF powers during their aging in ambient air (a)–(c) and in distilled water (d)–(f).
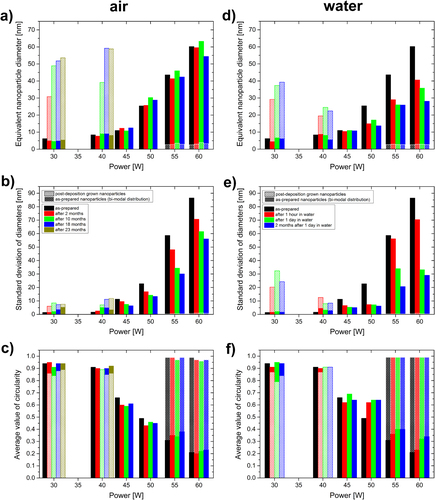
Figure 6. Electron diffraction patterns of Ag/a-C:H:O nanocomposite films deposited at the RF power of 30 W (top left) and 50 W (top right) as measured right after the deposition and Ag/a-C:H:O nanocomposite film deposited at RF power of 30 W, as measured after 23 months of aging in ambient air (bottom left) and after 1 day of aging in distilled water (bottom right). Each pattern is displayed with corresponding Miller indices.
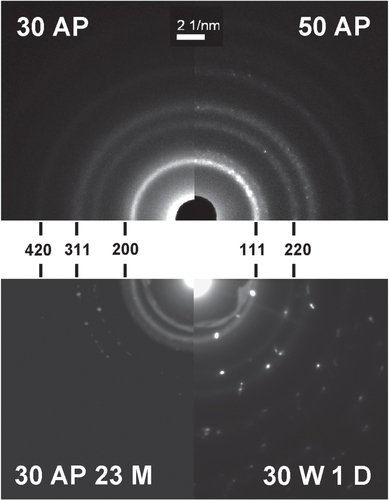
Figure 7. UV–vis–NIR absorbance spectra of Ag/a-C:H:O nanocomposite films deposited at different RF powers as measured right after their deposition. The optical spectrum of the glass substrate is displayed for comparison. Each of the films is listed with its corresponding thickness.
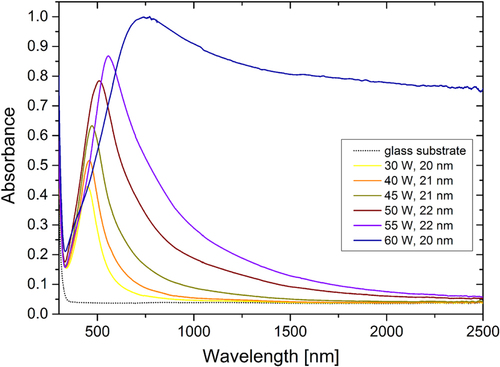
Figure 8. UV–vis–NIR absorbance spectra of the Ag/a-C:H:O nanocomposite films deposited at the RF powers of 30 and 50 W (left) and 60 W (right). The spectra were measured right after the deposition, and after aging in air for 1 month and 22 months and in water for 1 day. The optical spectrum of the glass substrate is displayed for comparison.
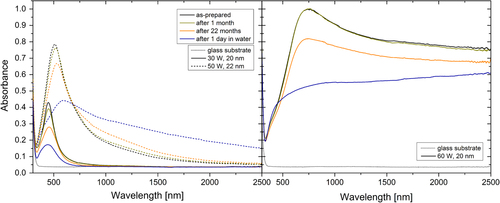
Figure 9. Changes in the parameters of the surface plasmon resonance of Ag/a-C:H:O nanocomposite films deposited at different RF powers during aging of the films in ambient air and in distilled water: (a) intensity of absorbance at the wavelength of the SPR and at the wavelength of 1000 nm, (b) position of the absorbance maximum, (c) width of the SPR peak (FWHM).
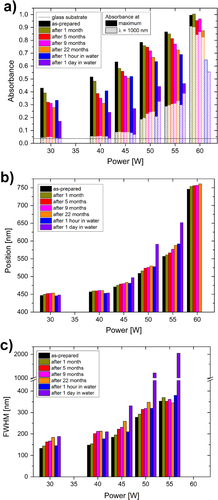
Table 1. Observed influence of an increasing deposition power and aging on the microstructural and SPR parameters of the Ag/a-C:H:O nanocomposite films.
Table 2. Theoretical influence of increasing values of the respective microstructural parameters on the characteristics of SPR.