Figures & data
Figure 1. (a) Atomic-force microscopy image of CFO NPs; (b) size distribution of the CFO NPs measured by means of dynamic light scattering.
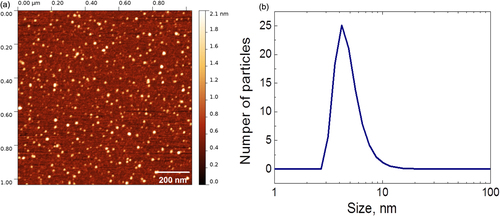
Figure 2. Fourier transform infrared spectrum of the CFO NPs.
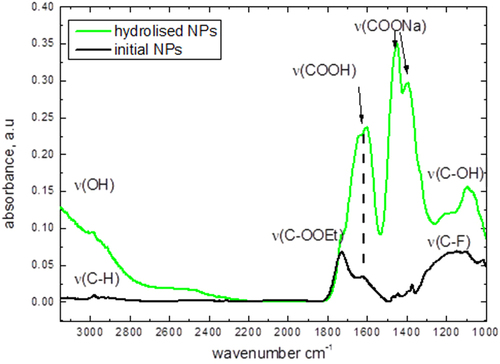
Table 1. Elemental composition of the CFO NPs.
Figure 3. (a) Absorbance and one-photon-excited (excitation wavelength: 400 nm) luminescence spectra of the CFO NPs dispersed in Krebs buffer solution at 0.1 mg ml−1 concentration; (b) excitation dependence of the CFO nanoparticles fluorescence.
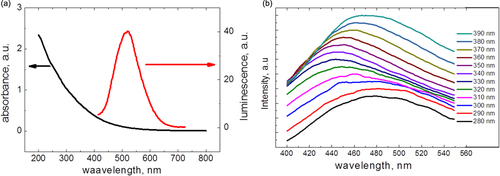
Figure 4. Fluorescence microscopy images of the cells labeled with CFO NPs: (a) one-photon excited fluorescence microscopy, excitation: 490 nm, emission: 525 nm; (b) two-photon excited fluorescence microscopy, excitation: 790 nm, emission channels: green (480–490 nm), yellow (500–550 nm), red (610–630 nm). Control cell lines without NPs are shown as inserts.
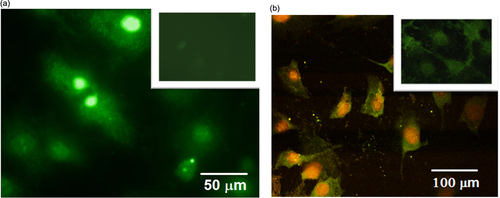
Figure 5. 3T3-L1 cells labeled with CFO NPs (1 mg ml−1) before (a) and after (b) ultrasound treatment. Non-labeled 3T3-L1 cells before (c) and after (d) ultrasound treatment are shown for comparison.
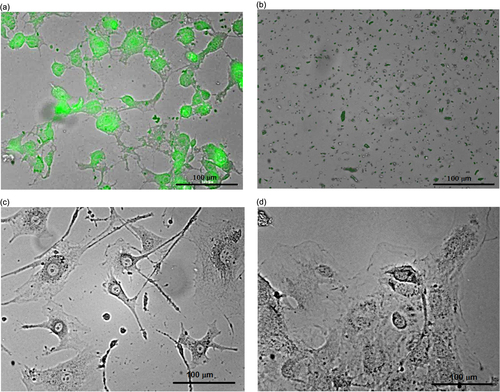
Figure 6. Dose response curves of the 3T3-L1 cell numbers. The arrow shows the times when the CFO NPs were added.
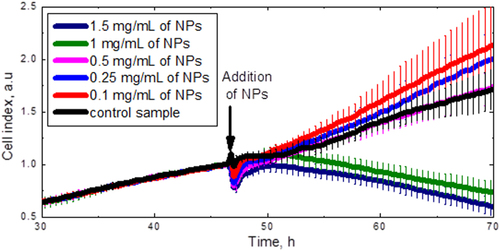
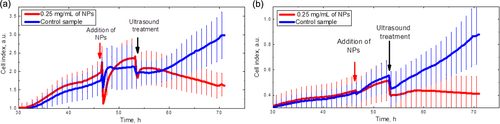
Figure 7. Time evolution of the cell number: (a) 3T3-L1 cell line; (b) HuH7 cancer cell line. Arrows show when the CFO NPs were added and ultrasound treatment was switched on.