Figures & data
Figure 1. In situ AFM images (scan size 5 × 5 μm2, z-scale 500 nm) of (A) NTR7450 and (B) NF270.
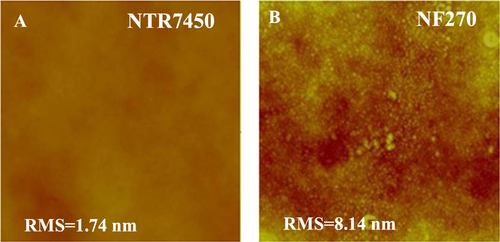
Figure 2. In situ AFM images (scan size 5 × 5 μm2, z-scale 500 nm) of DPPC/MO vesicles deposited on NTR7450 surface with different RMO values, (A) RMO = 0, (B) RMO = 3/7, (C) RMO = 5/5 and (D) RMO = 7/3; DOPC/MO vesicles deposited on NTR7450 surface with different RMO, (E) RMO = 0, (F) RMO = 3/7, (G) RMO = 5/5 and (H) RMO = 7/3.
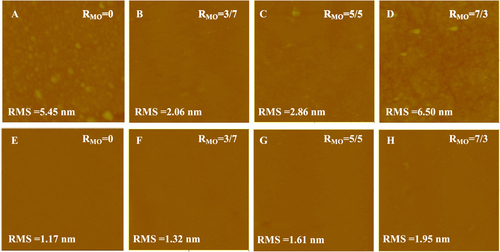
Figure 3. In situ AFM images (scan size 5 × 5 μm2, z-scale 500 nm) of DPPC/MO vesicles deposited on NF270 surface with different RMO values, (A) RMO = 0, (B) RMO = 3/7, (C) RMO = 5/5 and (D) RMO = 7/3; DOPC/MO vesicles deposited on NF270 surface with different RMO, (E) RMO = 0, (F) RMO = 3/7, (G) RMO = 5/5 and (H) RMO = 7/3.
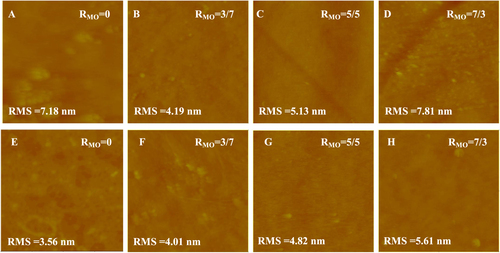
Figure 4. FTIR spectra of NF membrane supported lipid membranes. Top: NTR7450 SLBs (RMO = 5/5) membrane (A); bottom: NF270 SLBs (RMO = 5/5) membrane (B).
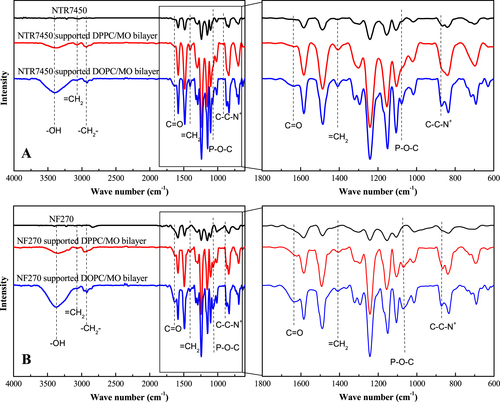
Table 1. Zeta potential of various membranes (pH = 7.5, 1 mM KCl).
Figure 5. Confocal fluorescence images of NTR7450 supported DPPC/MO and DOPC/MO bilayers with 0.5 wt% NBD-PE. (A) DPPC (RMO = 0), (B) DPPC/MO (RMO = 5/5), (C) DOPC (RMO = 0), (D) DOPC/MO (RMO = 5/5). Inset of (A) is the fluorescence image of virgin NTR7450.
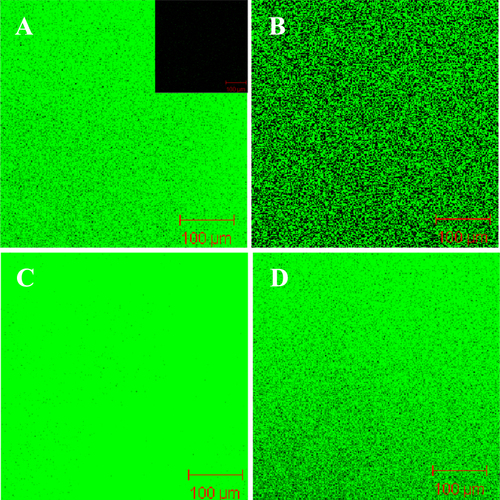
Figure 6. Confocal fluorescence images of NF270 supported DPPC/MO and DOPC/MO bilayers with 0.5 wt% NBD-PE. (A) DPPC (RMO = 0), (B) DPPC/MO (RMO = 5/5), (C) DOPC (RMO = 0), (D) DOPC/MO (RMO = 5/5). Inset of (A) is the fluorescence image of virgin NF270.
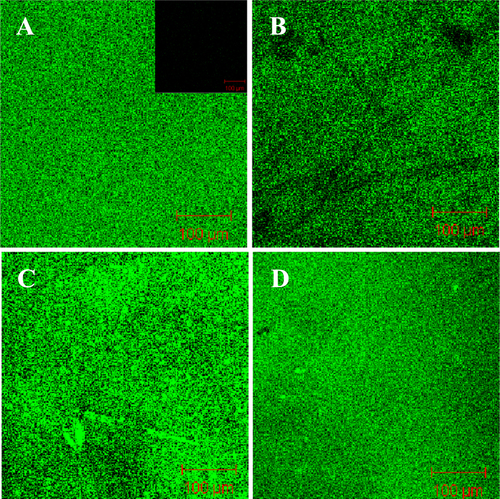
Figure 7. The FRAP curves of NTR7450 (A) and NF270 (B) SLB membranes.
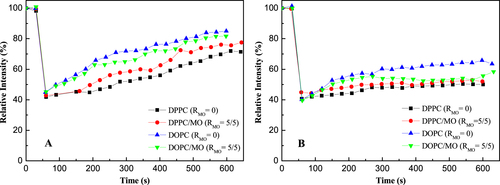
Figure 8. Contact angles of NTR7450 and NF270 SLB membranes. Each point represents the mean ± standard deviation of three samples.
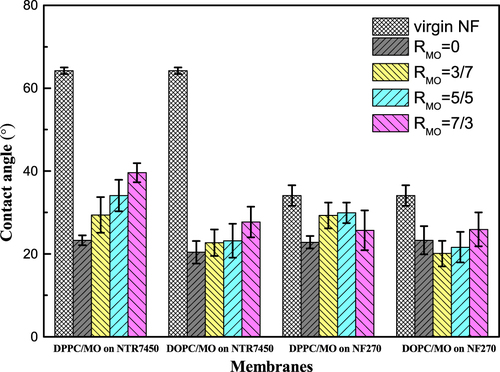
Table 2. Pure water flux (LMH) of NF SLBs membranes.
Figure 9. Effect of different content of MO SLBs on the relative pure water flux of SLB membranes.
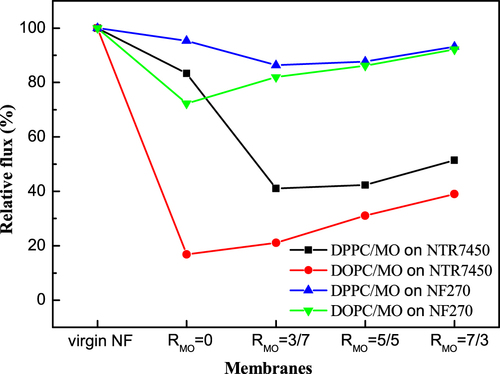
Figure 10. Pure water flux of NTR7450 and NF270 supported DPPC, DPPC/MO (RMO = 5/5), DOPC, and DOPC/MO (RMO = 5/5) bilayer membranes with different RAQP1.
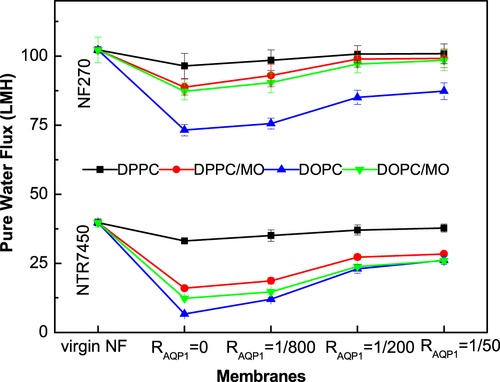
Table 3. Pure water flux increments (LMH) induced by the incorporation of AQP1.
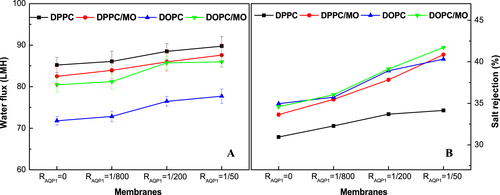
Figure 11. Water flux (A) and NaCl rejection (B) of NTR7450 supported DPPC, DPPC/MO (RMO = 5/5), DOPC, and DOPC/MO (RMO = 5/5) bilayer membranes with different RAQP1.
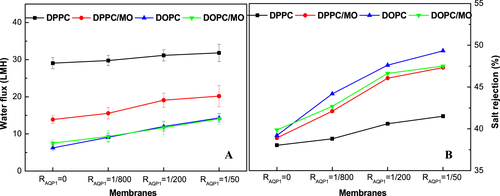
Figure 12. Water flux (A) and NaCl rejection (B) of NF270 supported DPPC, DPPC/MO (RMO = 5/5), DOPC, and DOPC/MO (RMO = 5/5) bilayer membranes with different RAQP1.