Figures & data
Table 1. Comparison of polyphenol detection limits in recent studies.
Scheme 1. Representation of electron transfer of laccase immobilized on carbon nanotube.
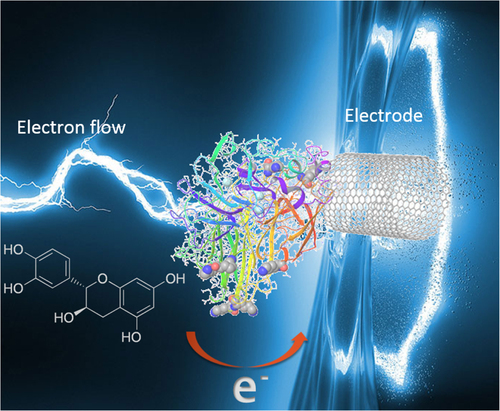
Figure 1. General morphology of the nitrogen-doped carbon nanotubes. (a) SEM image showing a carpet-like morphology with parallel nanotubes. (b) TEM image displaying the structure of the nanotubes, with a bamboo-like morphology typical of nitrogen-doped carbon nanotubes [Citation13]. (c) High resolution TEM image of a nitrogen-doped carbon nanotube; notice the curvature due to the incorporation of nitrogen [Citation13]. More figures are included in the supplementary materials (figures 2S–5S).
![Figure 1. General morphology of the nitrogen-doped carbon nanotubes. (a) SEM image showing a carpet-like morphology with parallel nanotubes. (b) TEM image displaying the structure of the nanotubes, with a bamboo-like morphology typical of nitrogen-doped carbon nanotubes [Citation13]. (c) High resolution TEM image of a nitrogen-doped carbon nanotube; notice the curvature due to the incorporation of nitrogen [Citation13]. More figures are included in the supplementary materials (figures 2S–5S).](/cms/asset/81256b3e-2ef9-4a93-bffb-09070ff3995a/tsta_a_11661335_f0001_ob.jpg)
Figure 2. XPS of CNx-MWCNTs synthesized at 900 °C. The two main peaks are indicative of the nitrogen bonded to the nanomaterial. The red line is the raw signal and the black line corresponds to the second order Savitzky–Golay smoothing.
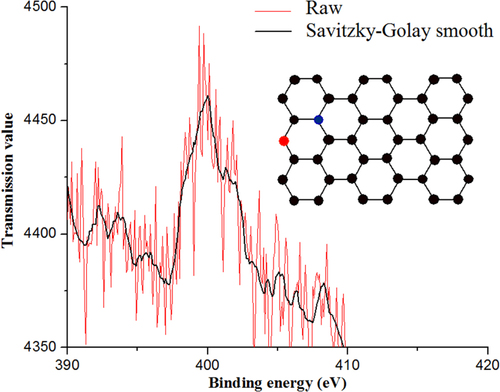
Figure 3. Effect of ethanol on catalytic activity using Lac/CNx-MWCNT and Lac/GO measured by HPLC.
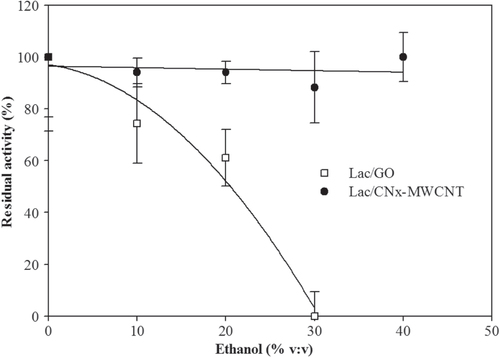
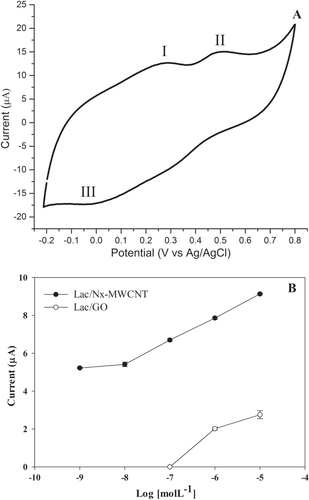
Figure 4. Voltammograms recorded using (A) Lac/CNx-MWCNT on catechol, (B) Lac/GO hybrid on catechol, (C) Lac/CNx-MWCNT hybrid on catechin, and (D) Lac/GO hybrid on catechin.
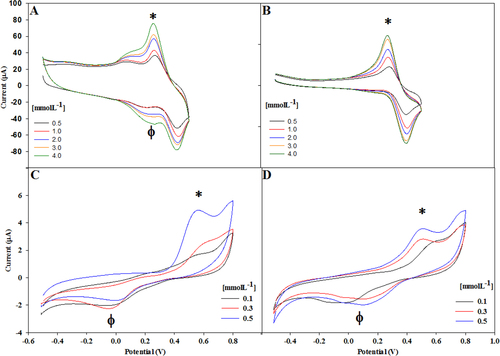
Figure 5. Catechin detection in white wine voltammogram. (A) Sites 1 and 2 represent the oxidation peaks and site 3 the reduction peak. This type of wine contains one of the lowest concentrations of catechin. (B) Limit of detection of catechin with laccase on CNx-MWCNT and GO. The assays were done in triplicate (table 1S, supplementary materials).