Figures & data
Figure 1 Schematic phase diagram of pure metal as function of pressure and temperature. Tm: melting temperature; O: triple point; T0: the temperature of triple point; O′: point reached by super-cooling; and ΔT: degree of supercooling.
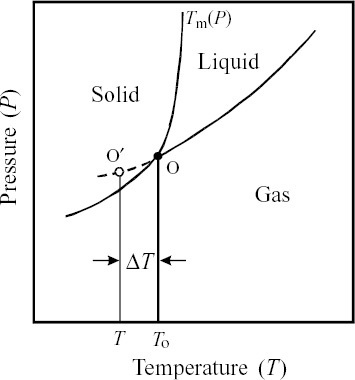
Figure 2 Schematic diagram of radial distribution function for liquid and its atomic distribution. Dotted line shows the example of SRO in liquid.
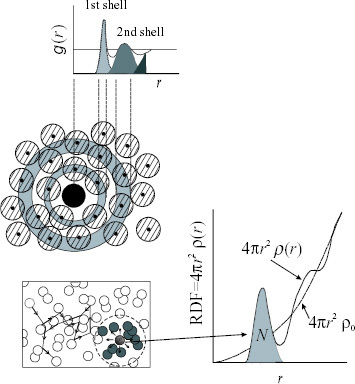
Figure 3 Five polyhedra formed by packing equal spheres found in model structure for liquid by Bernal [Citation27–29]: (a) tetrahedron, (b) octahedron, (c) triangular prism capped with three half-octahedra, (d) Archimedian anti-prisms capped with two half-octahedra, and (e) tetragonal dodecahedron.
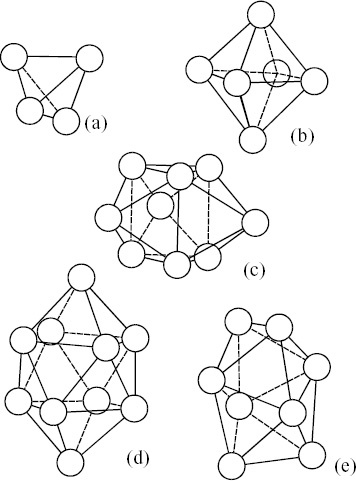
Figure 4 Average RDF and environmental RDFs for Cu and Ni of Pd40Ni10Cu30P20 alloy in liquid (a) and glassy (b) states. Dotted lines show the results calculated using the nonlinear least-squares fitting method so as to reproduce the experimental data using a model structure formed by eight Pd atoms around Cu [Citation33].
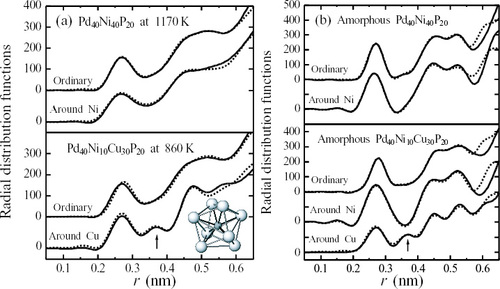
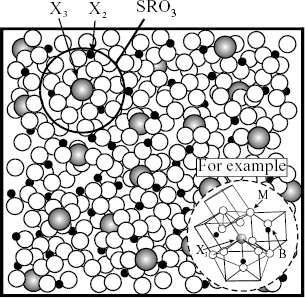
Figure 5 Local orderings consisting of trigonal prisms including M proposed for Fe70-B20-(X3)10 (X3=Hf, Zr, Nb, W and Cr) glassy alloys (a) [Citation34], and Pd80Si20 glassy alloy (b) [Citation36]. The distances between Si and Pd1 and Si and Pd2 are 0.24 nm and 0.28 nm, respectively.
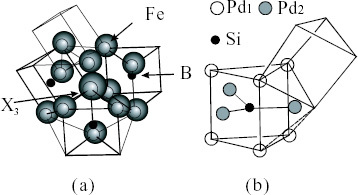
Figure 6 High-resolution images of local structures for the Pd40Ni40P20 glassy alloy taken from results obtained by spherical-aberration(Cs)-corrected high-resolution TEM. The spherical aberration constant of the objective lens was Cs=2 μm. Images are taken at underfocus Δf=1 nm (a), 5 nm (b) and 9 nm (c) [Citation35].
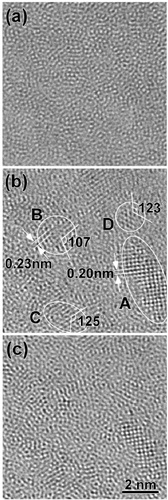
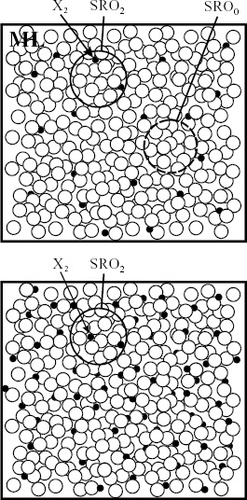
Figure 7 Model I for liquid alloys when second element (X2) is added to metallic solvent (M). (a) Image of coexistence of SRO0 and SRO2 in dilute region of X2 and (b) image for liquid structure characterized mainly by SRO2 with increasing X2 concentration. ML: mean liquid structure of solvent M.
Some numerical examples of volume mismatch ΔVMX2/VM, minimum concentration CX2m and atomic size difference factor λ for binary alloys [Citation42, Citation43].
Atomic size difference factor of λ for nine binary alloys at both ends of phase diagram [Citation42, Citation43].
Figure 8 Model II for liquid alloys when small amount of third element (X3) is added to metallic solvent (M) containing X2. Image of formation of stable cluster (SC) or (MRO, SRO3) by harmonious coupling in harmony with more than two kinds of SRO.
Minimum concentration of boron CBm or phosphorus CPm (second element X2) at constant CX3 for third element X3 and atomic size difference factor λ′ for some ternary alloys, namely, Fe-BX-(X3)10, Fe-PX-(X3)10 and Co-BX-(X3)10 [Citation43].
Figure 9 Schematic diagram illustrating use of interaction parameter εX2X3 (solvent: Fe, solute X2: B and solute X3: Si or Cr).
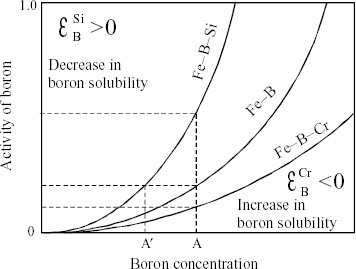
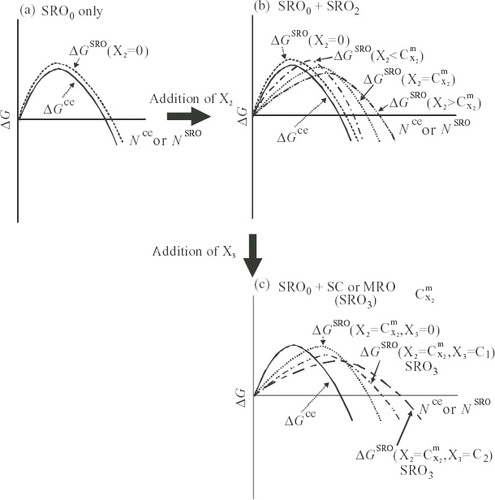
Figure 10 Schematic diagram of relative relationships for excess free energies of crystal embryo, ΔGce, and noncrystalline cluster, ΔGSRO, in liquid with respect to reference state of matrix liquid. (a) Non-glass-forming alloys, (b) alloys with X2 showing GFA and (c) alloys with X2 and X3 showing good GFA.