Figures & data
Figure 1 Schematic configuration of the powder sample and the x-ray beam path from the source to the detector. The powder sample is fixed using Apiezon grease on the copper holder in the cryostat. The x-ray scattering vector is perpendicular to the magnetic field vector.
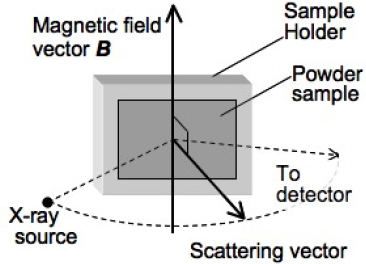
Figure 2 Temperature dependence of the magnetization of MnBi in magnetic fields of 0.4 and 5 T. The vertical arrow indicates the previously determined spin reorientation temperature TSR.
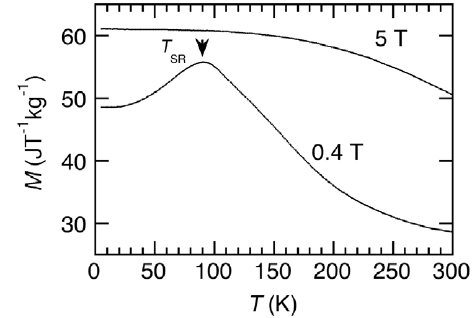
Figure 3 Powder x-ray diffraction patterns of MnBi in magnetic fields of 0 and 4 T at 292 K (a) and in magnetic fields of 0 and 5 T at 8 K (b).
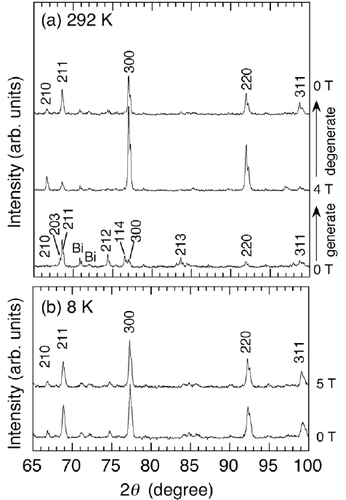
Figure 4 Temperature dependences of the lattice parameters a (a), c (b) and the cell volume V (c) of MnBi in a zero magnetic field. The vertical arrows indicate the characteristic temperatures of the spin reorientation TSR and TSR1. The broken line is a guide to the eyes.
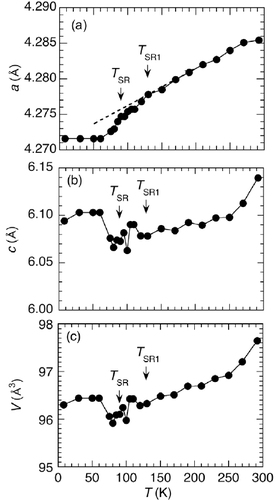
Figure 5 Temperature dependence of the lattice parameter a of MnBi in 5 T (open circles). The data in a zero magnetic field (solid circles) are also illustrated for comparison.
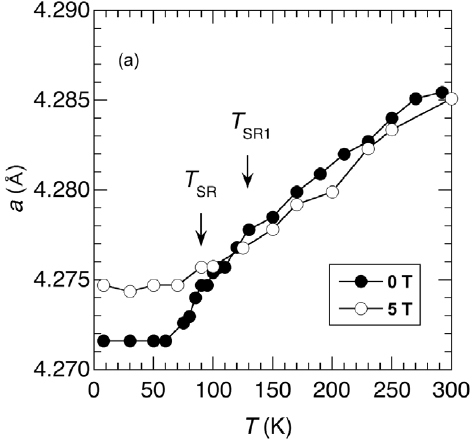
Figure 6 DTA curves for MnBi in various magnetic fields up to 14 T [Citation8]. The data were obtained during heating. The vertical arrows indicate the previously determined phase transition temperatures.
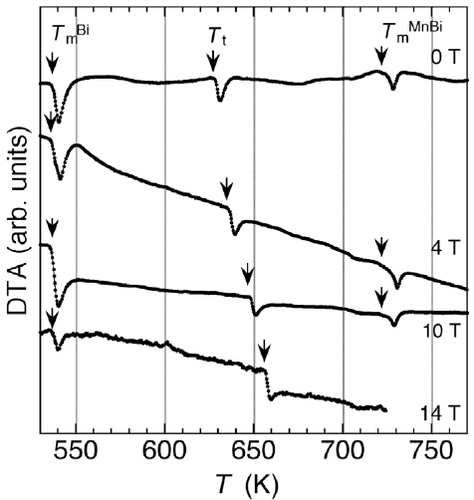
Figure 7 Temperature dependence of the magnetization of MnBi in various magnetic fields up to 10 T in the vicinity of the magnetic phase transition temperature, Tt [Citation9]. The vertical arrows indicate the previously determined Tt.
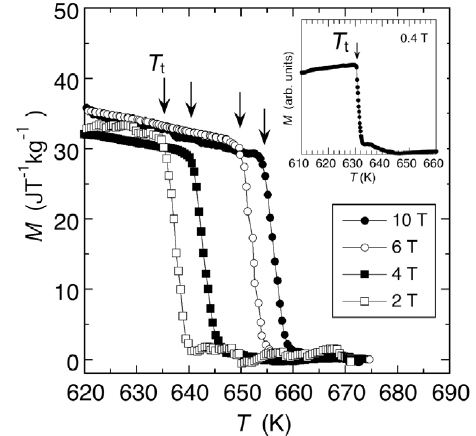
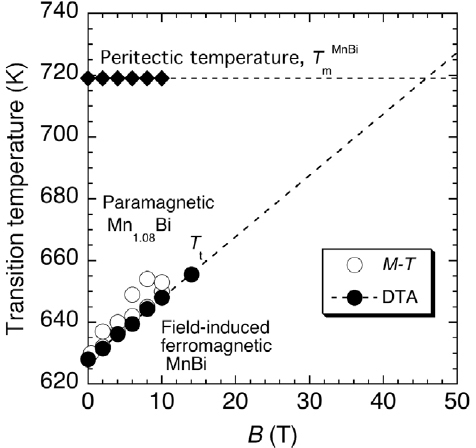
Figure 8 Magnetic phase diagram of MnBi. The solid and open circles indicate Tt determined by DTA [Citation8] and the magnetic measurement [Citation9] data, respectively. The solid diamonds indicate the peritectic temperature TmMnBi determined by the DTA data. The broken lines indicate the extrapolation calculated by the least-squares method for Tt and TmMnBi using the data determined by DTA.