Figures & data
Scheme 1 Structures of electron donors and acceptors.
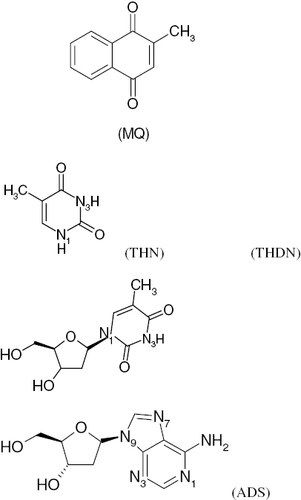
Figure 1 Transient absorption spectra of (1) MQ (0.2 mM) (□) and (2) MQ (0.2 mM)-THN (2.0 mM) (▴) in ACN after 1.0 μs time delay after laser pulse with excitation wavelength of 355 nm.
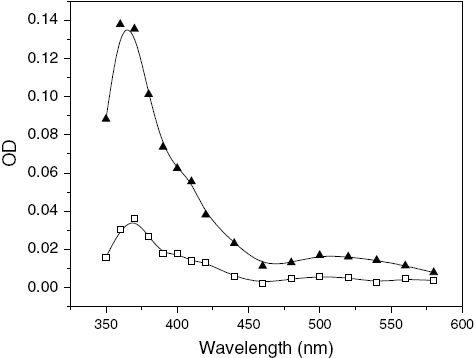
Figure 2 Transient absorption spectra of (1) MQ (0.2 mM) (▪) and (2) MQ (0.2 mM)-THDN (2.0 mM) (utri;) in ACN after 1.0 μs time delay after laser pulse with excitation wavelength of 355 nm.
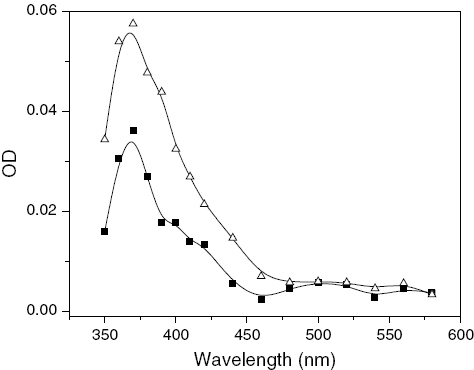
Figure 3 Transient absorption spectra of MQ (0.4 mM) in (1) absence (▪) and (2) presence of magnetic field (○), and MQ (0.4 mM) – THN (5.0 mM) in (3) absence (✦) and (4) presence of magnetic field (▴) in SDS micelles after a delay of 1.0 μs.
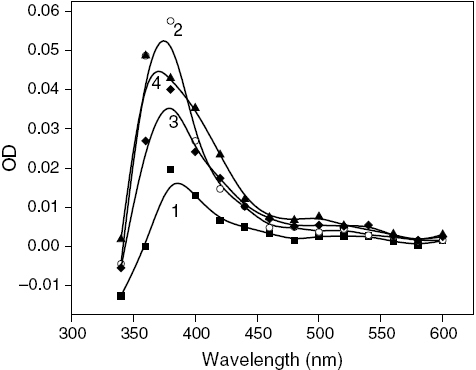
Figure 4 Transient absorption spectra of MQ (0.4 mM) in (1) absence (▪) and (2) presence of magnetic field (○), and MQ (0.4 mM) – THDN (5.0 mM) in (3) absence (▴) and (4) presence of magnetic field (▾) in SDS micelles after a delay of 1.0 μs.
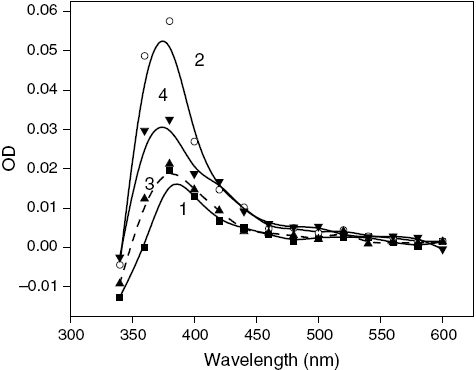
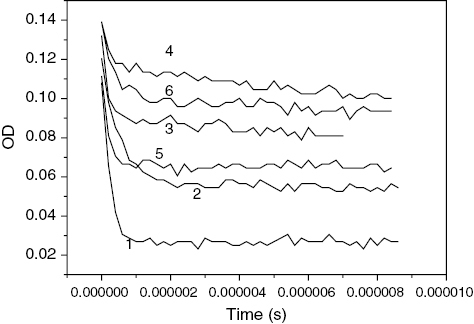
Figure 5 Normalized OD traces at 380 nm obtained by laser flash photolysis (λ=355 nm) of MQ (0.2 mM) in SDS in (1) absence and (2) presence of magnetic field, MQ (0.2 mM) and THN (2.0 mM) in (3) absence and (4) presence of magnetic field, and MQ (0.2 mM) and THDN (2.0 mM) in (5) absence and (6) presence of magnetic field.