Figures & data
Figure 1 Temperature dependences of magnetic moment measured during field cooling in a magnetic field of H=1 kOe, in the Ge:Mn film (x=4%). The dc magnetic field is normal to the film plane, θH=90°.
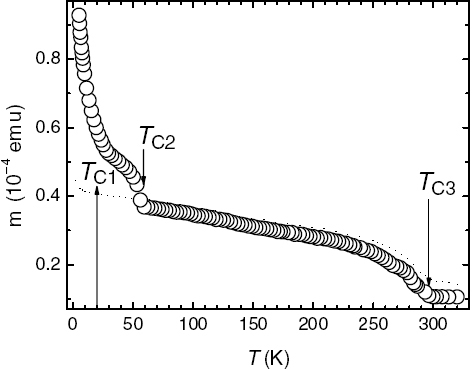
Figure 2 X-band ESR spectra of the Ge:Mn film (x=4%) at (a) T=100 K and (b) T=262 K. The static magnetic field H is parallel to the film plane. The solid gray line is an approximation based on the magnetoresistance background (equation (1)), as described in the text.
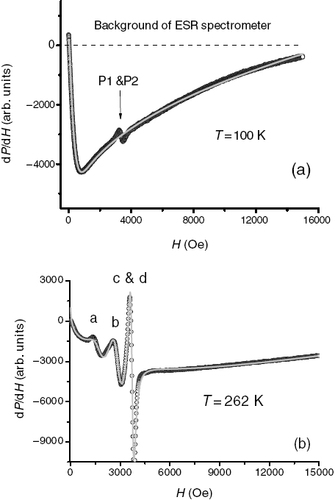
Figure 3 ESR spectra of the Ge:Mn nanowires (x=1, 3 and 5%) at T=292 K. The static magnetic field H is parallel to the nanowires.
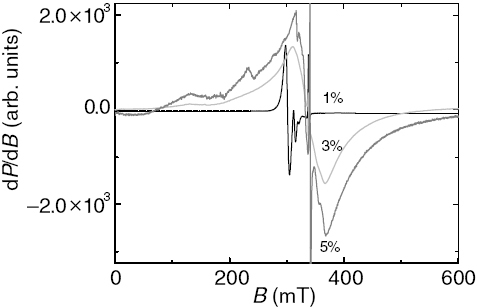
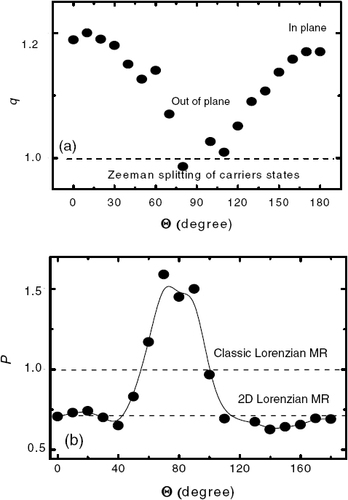
Figure 4 Angular dependences of exponents q (a) and p (b) (equation (1)) at T=270 K, which describe the low- and high-field components of the magnetoresistance, respectively. The size of the symbols corresponds to the error bar. Horizontal lines show predictions corresponding to different magnetoresistance models.