Figures & data
Figure 1 Sketches of the different orientations of the working electrode and the magnetic field that were investigated in the present paper.
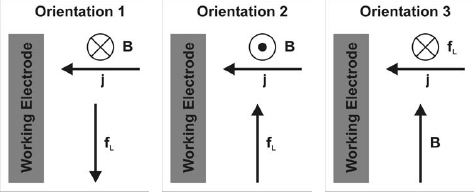
Figure 2 Transients of the total (A) and the partial current density (B) of Ni deposition for various magnetic flux densities in orientation 2. Black solid line: no B field, red dashed line: 0.42 T, green dotted line 0.60 T, blue dash-dotted line: 0.72 T.
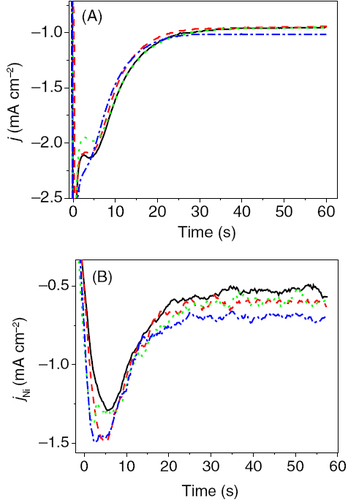
Figure 3 Transients of the total (A) and the partial current density (B) of Ni deposition for various magnetic flux densities in orientation 1. Black solid line: no B field, red dashed line: 0.42 T, green dotted line 0.60 T, blue dash-dotted line: 0.72 T.
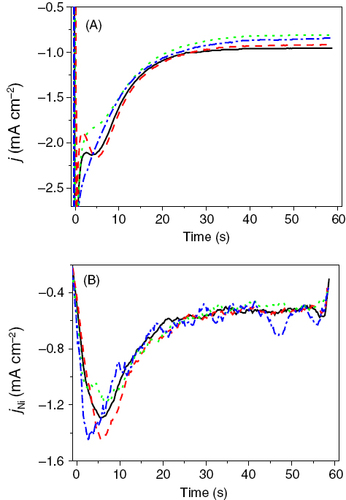
Figure 4 Nucleation site density (N0) for Ni deposition in orientation 1 (black circles) and orientation 2 (red squares) as a function of the magnetic flux density.
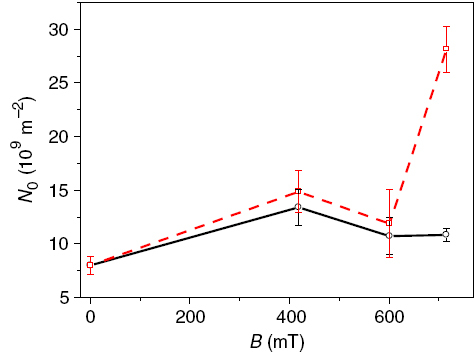
Figure 5 AFM height images of the Ni layers deposited at −1.1 V without magnetic field (A), B=0.7 T T in orientation 1 (B) and B=0.7 T in orientation 2 (C).
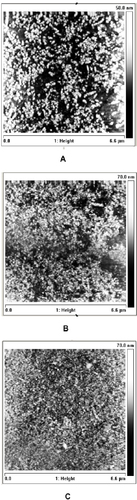
Number of grains and the mean grain size mean for the Ni layers deposited at −1.1 V for different orientations of the magnetic field (see figure for a sketch of the orientations).
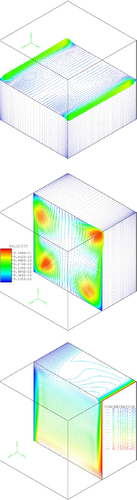
Figure 6 Results of the 2D numerical simulation of the electrolysis of copper sulfate in a rectangular cell in orientation 2. The cathode (copper deposition) is on the left side of the cell. Sc=2000; Ra=105; Nc=10−2. From left to right: velocity, concentration, Lorentz force and curl of the Lorentz force.
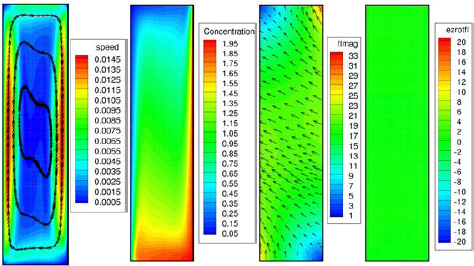
Figure 7 Results of the 3D numerical simulation of the electrolysis of copper sulfate in a cubic cell in orientation 3. The cathode (copper deposition) is on the left side of the cell. The relatively strong magnetic field causes horizontal swirl (middle) which supersedes the concentration-driven convection (top). The bottom image shows the concentration profile under the conditions of MHD driven convection. Sc=2000, Ra=106, Nc=10−2.