Figures & data
Figure 1 Electrode configuration in the magneto-electrodeposition process in a superconducting magnet. A magnetic field B is applied parallel (+) or antiparallel (−) to the faradaic current, and perpendicular to the electrode surface.
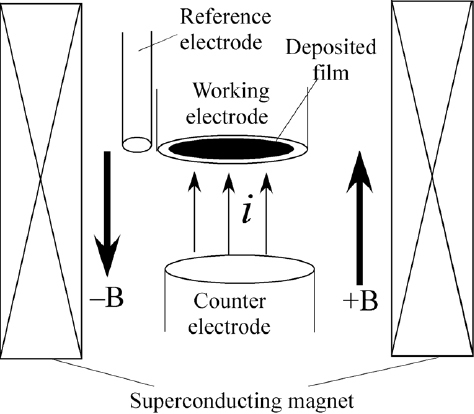
Figure 2 Voltammogram of 50 mM AgNO3 in 0.1 M NaClO4 aqueous solution. The potential sweep rate was 10 mV s−1. The chiral Ag films were magneto-electrodeposited in the potential region indicated by arrows.
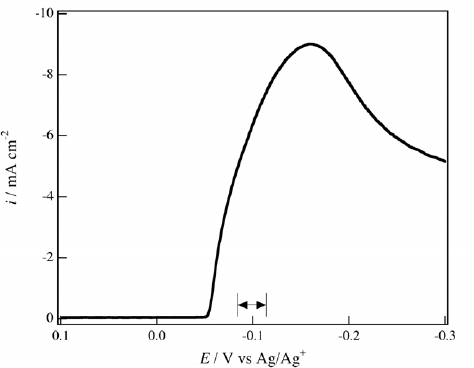
Figure 3 Voltammograms of 20 mM D- and L-glucoses in 0.1 M NaOH aqueous solution on the Ag electrodes of (a) the +2 T-film and (b) the -2 T-film. The potential sweep rate was 50 mV s−1.
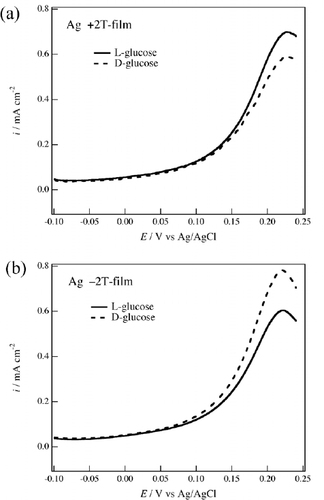
Figure 4 Voltammograms of 20 mM L-cysteine in 0.1 M NaOH aqueous solution on the Ag electrodes of (a) the ±2 T-films and (b) the ±0.5 T-films. The potential sweep rate was 50 mV s−1.
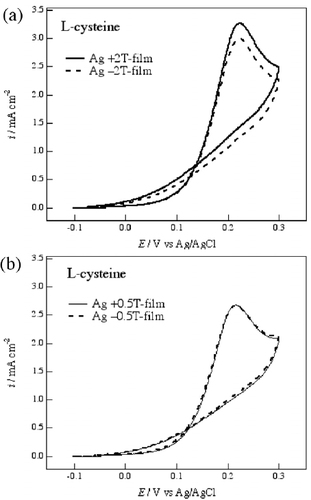
Figure 5 Voltammogram of 50 mM CuSO4 in 0.1 M Na2SO4 aqueous solution. The potential sweep rate was 10 mV s−1. The chiral Cu films were magneto-electrodeposited at the potential indicated by an arrow.
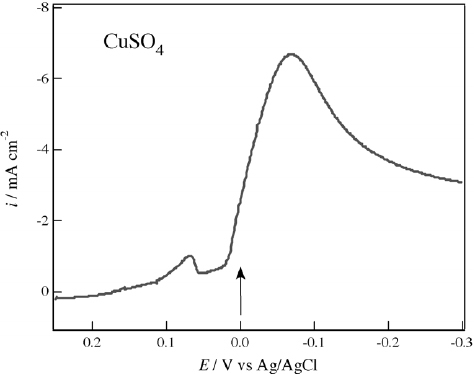
Figure 6 Voltammograms of 20 mM D- and L-glucoses in 0.1 M NaOH aqueous solution on the Cu electrodes of (a) the +2 T-film and (b) the -2 T-film. The potential sweep rate was 50 mV s−1.
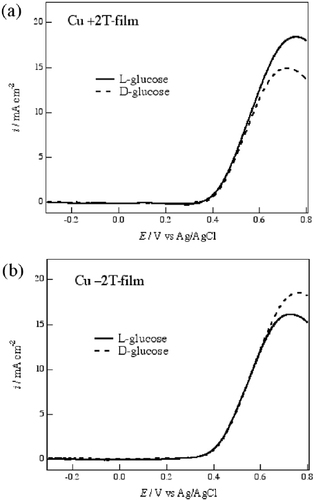
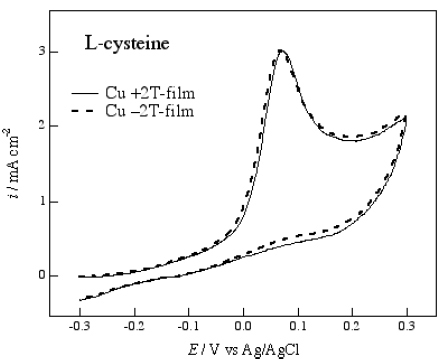
Figure 7 Voltammograms of 20 mM L-cysteine in 0.1 M NaOH aqueous solution on the Cu electrodes of the +2 T- and -2 T-films. The potential sweep rate was 50 mV s−1.