Figures & data
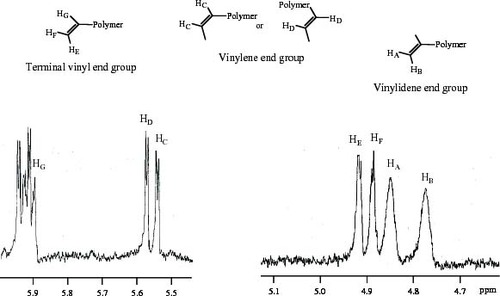
Figure 1 Region of unsaturated chain end groups in 1H-MR spectrum of MiPP.
Molecular characteristics of ZiPP, MiPP and ZiPP/MiPP polymer blends.
Figure 2 Changes in ratio of molecular weights (Mn, t/Mn, 0) of ZiPP and ZiPP/MiPP during thermal oxidative degradation at 130 °C; Mn, t and Mn, 0 are number average molecular weights after and before thermal oxidative degradation, respectively.
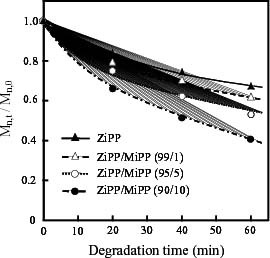
Figure 3 Weight change curves of ZiPP and ZiPP/MiPP at 130 °C in air.
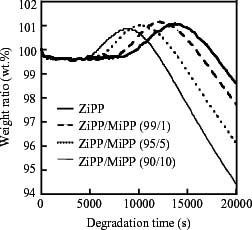
Figure 4 Arrhenius plots of duration of induction period (tdi) for thermal oxidative degradation of ZiPP and ZiPP/MiPP.
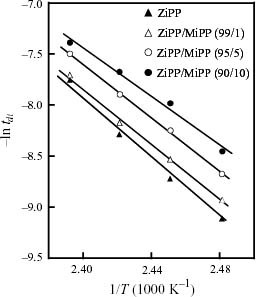
Figure 5 Apparent activation energy (ΔE) versus content of unsaturated chain end group.
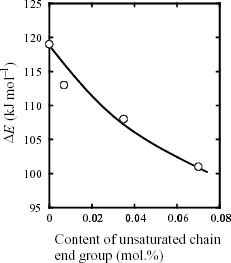
Value of tdi at various temperatures and apparent activation energies (ΔE).