Figures & data
Polymerisation conditions of PP samples.
Polymerisation conditions of EP copolymers.
Polymerisation conditions of PE samples.
Viscosimetry, DSC and 13C-NMR characterisation of PP samples.
Viscosimetry, DSC and 13C − NMR characterisation of EP copolymers.
Viscosimetry and DSC characterisation of PE samples.
Figure 1 Mechanodynamical loss modulus curve of PP92.4. (○) Experimental, (—) calculated, (····) single components.
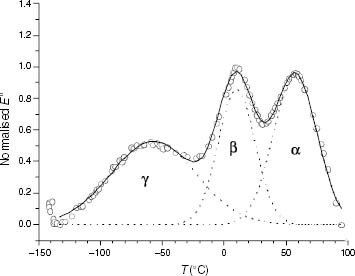
Figure 2 Arrhenius plot of ti for EP6.2. The 1/ T scale is normalised to the melting point.
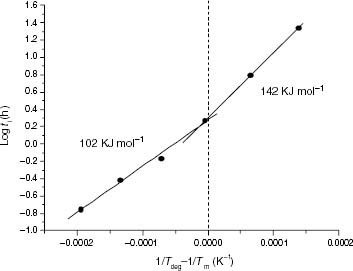
Figure 3 ICL kinetics of EP1.1 at degradation temperatures between 90 and 130 °C.
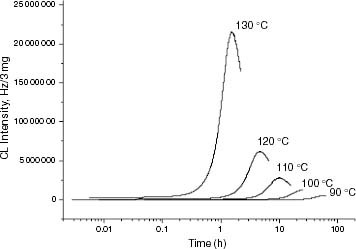
Figure 4 ICL kinetics of iPP samples at 120 °C: (○) PP178.1, (—) PP147.8, (····) PP131.9, (– – –) PP99.5, (–·–) PP92.4, (□) PP77.9.
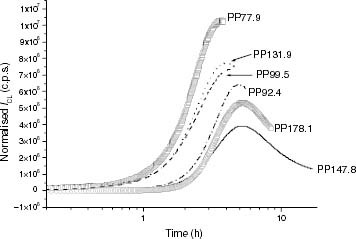
Figure 5 ICL kinetics of propylene-rich EP samples at 120 °C: (—–) EP0.6, (– – –) EP1.1, (····) EP3.3, (–·–) EP5.1, (—) EP6.1, (–··–) EP23.3.
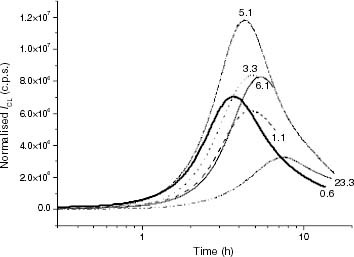
Figure 6 ICL kinetics of PE and ethylene-rich EP samples at 120 °C: (—–) PE242.5, (—) EP99.7, (– – –) EP99.0.
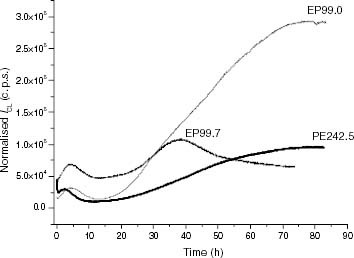
Figure 7 Photoluminescence emission spectra: (a) PP and propylene-rich EP samples; (b) PE and ethylene-rich EP samples obtained under irradiation at λ exc = 270 nm and T = - 130 °C after a 0.5 s delay. Samples are identified in the graphs.
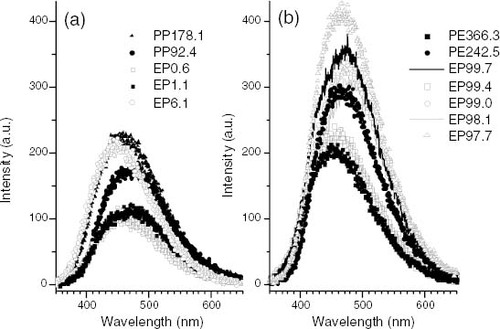
Figure 8 Variation of ti with the molar mass for PP samples (black symbols) and propylene-rich EP copolymers (white symbols).
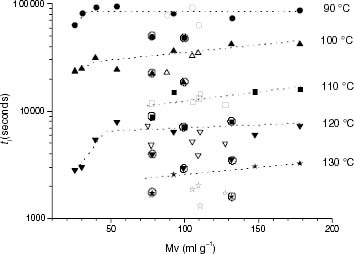
Figure 9 Variation of ti with the content of stereo defects for PP samples (black symbols) and propylene-rich EP copolymers (white symbols).
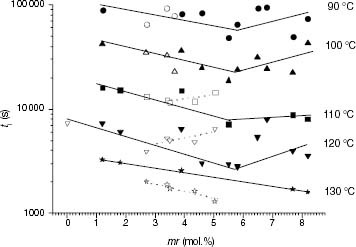
Figure 10 Variation of ti with the ethylene content.
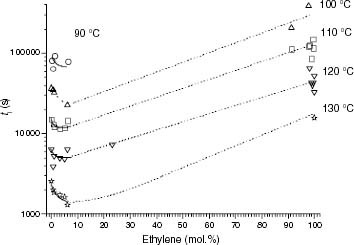
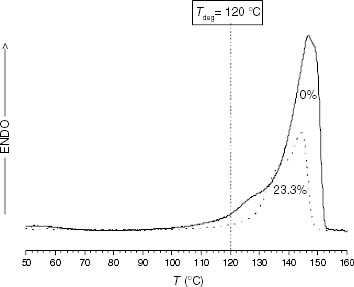
Figure 11 DSC melting endotherms of PP and propylene-rich EP samples (the ethylene content is indicated on each curve).
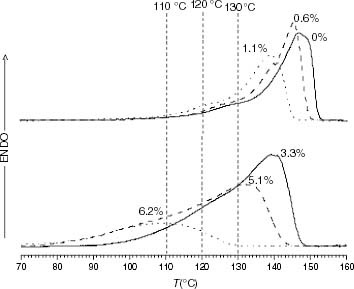
Figure 12 Variation of ti with the ethylene content for the propylene-rich EP copolymers.
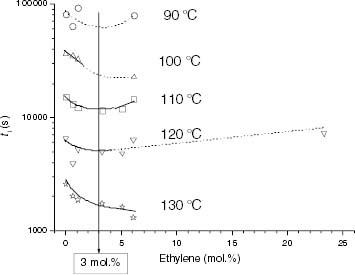
Figure 13 Variation of ti with the ethylene content for the propylene-rich EP samples at 110, 120 and 130 °C. Black points correspond to Tdeg < Tm and red points correspond to Tdeg > Tm.
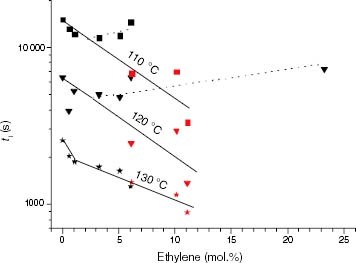
Figure 14 Variation of ti with the total of isotacticity interruptions for PP samples (black symbols) and propylene-rich EP copolymers (white symbols).
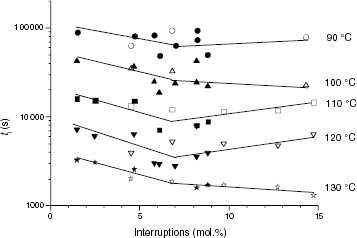
Figure 15 Methine window of the 13C-NMR spectra for EP0.6, EP1.1 and EP3.3.
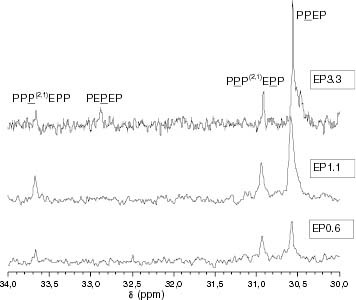
Figure 16 Changes in the 13C-NMR spectrum with the ethylene content showing the region corresponding to propylene-ethylene insertions of methylene, which are contiguous to methines. The chemical environment of the CH2 nuclei is shown in scheme 1.
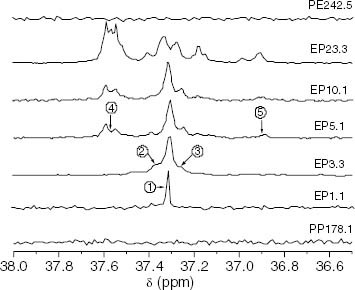
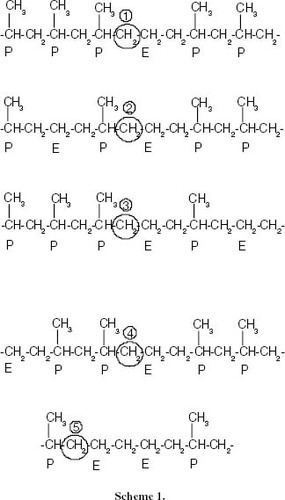
Figure 17 Variation of Eact of the thermo-oxidation in the solid state with the average isotactic length (n1) for PP samples (black symbols) and propylene-rich EP copolymers (white symbols). Red points correspond to the Eact values of EP samples degraded in the melt.
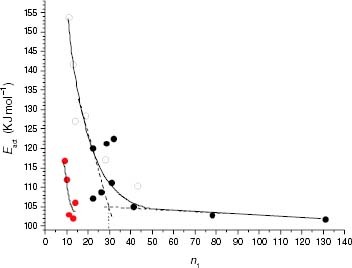
Figure 18 Variation of Eact with the ethylene content for the thermo-oxidation of propylene-rich EP copolymers in the solid state (black symbols) and molten state (red symbols). The range of Eact corresponding to PP samples is indicated on the Y-axis.
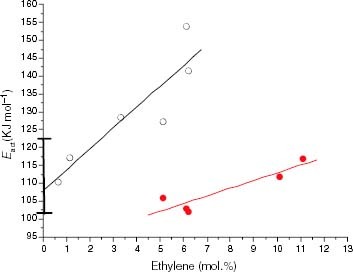
Figure 19 Variation of ti with the relative intensity of sub-Tg DMA relaxation.
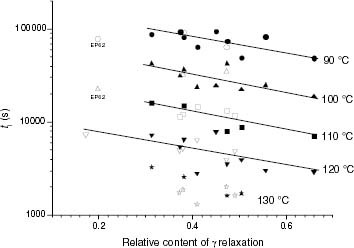
Figure 20 DSC melting endotherms of PP92.4 (—) and EP23.3 (····).