Figures & data
Chemical composition of different steels (wt.%).
Figure 1 Photograph showing as-coated DMR-1700 steel.
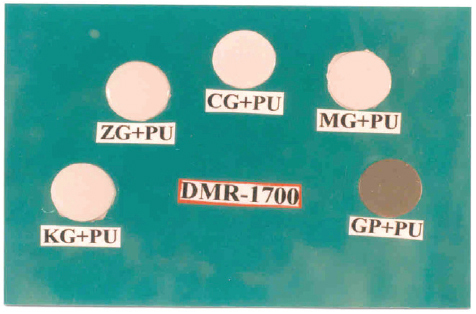
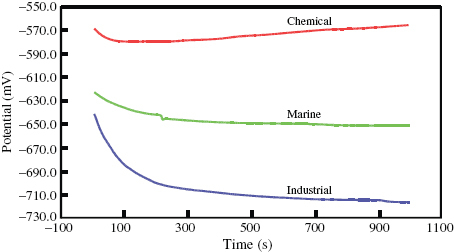
Figure 2 Variation of isolated electrode potential with time for DMR-1700 steel in different environments at room temperature.
Corrosion characteristics of DMR-1700 steel in different environments at room temperature.
Figure 3 Potentiodynamic polarization curves of the steel in various environments at room temperature.
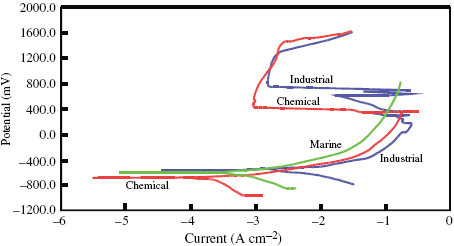
Figure 4 Cyclic polarization curves of DMR-1700 steel in different environments at room temperature.
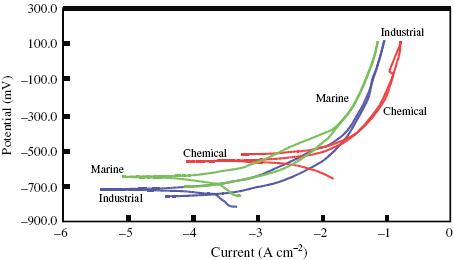
Figure 5 Surface morphologies of DMR-1700 steel after corrosion in different environments at room temperature.
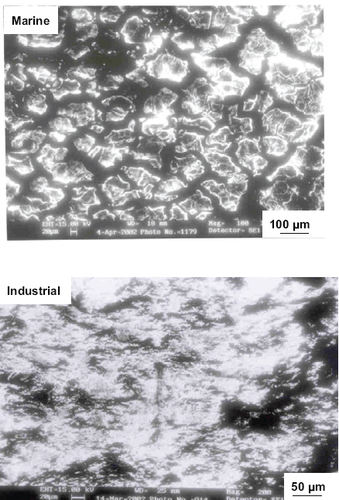
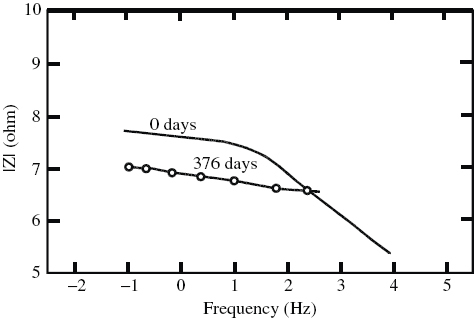
Figure 6 Variation of impedance for DMR-1700 steel in different environments at room temperature.
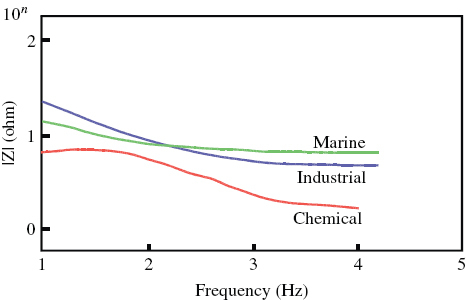
Figure 7 Nyquist plots of DMR-1700 steel in different environments at room temperature.
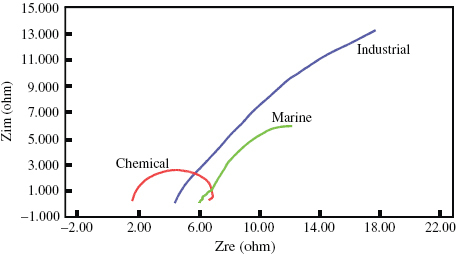
Figure 8 Phase variation as a function of frequency for DMR-1700 steel in different environments.
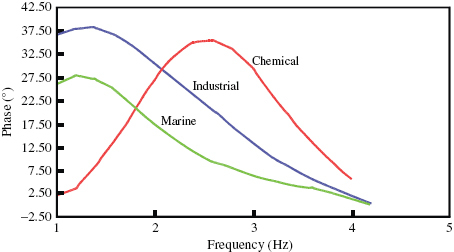
Figure 9 Characteristics of 96% zinc-rich coating on DMR-1700 steel.