Figures & data
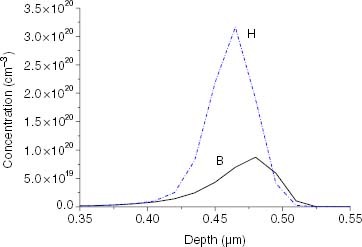
Figure 1 Depth profiles of B and H in diamond based on TRIM simulation. The solid line is the depth profile of B and the dot line is that of H.
Parameters of annealing process of film in range of 300–630 °C in quartz tube with Ar flux of 30 ml min-1.
Figure 2 The surface morphologies of diamond (a) and B-doped diamond (b) are shown, as determined by the AFM. The surface of the original sample (a) is quite smooth with small thorns; that of boron-doped diamond (b) is not smooth with a few small protuberances.
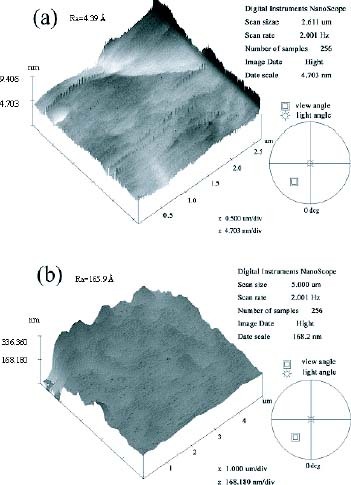
Figure 3 Raman spectra of diamond in various states. Line a is the Raman spectrum of the original sample. Line b is that of B-doped diamond (annealed at 1450 °C). Line c is that of hydrogenated B-doped diamond annealed at 560 °C and then washed in a boiling acid mixture and etched.
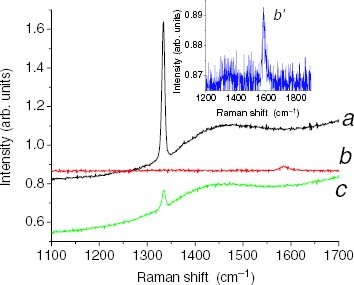
Figure 4 Annealing temperature dependence of resistivity in the range of 300–630 °C. The inset shows the annealing temperature dependence of resistivity in the range of 300–600 °C.
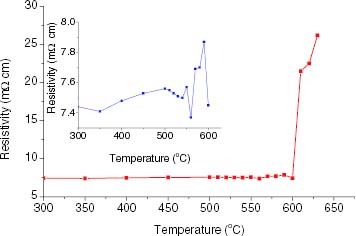
Figure 5 Annealing temperature dependence of carrier concentration in the range of 300–630 °C.
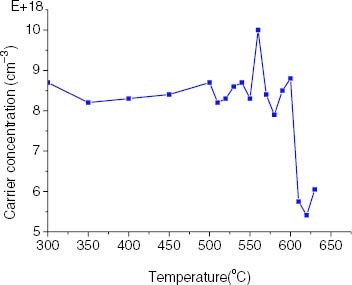
Figure 6 Optimized structures of diamond doped in (B+H) configurations: (a) B–2Hcc, (b) B–Hbc–H cc, and (c) B–2Hbc. The black, grey and white balls are C, B and H atoms, respectively.
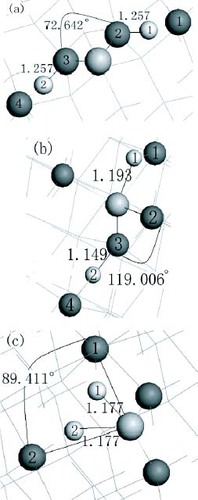
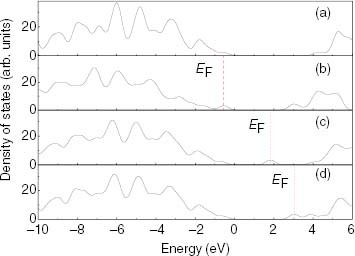
Figure 7 DOSs of (a) pure diamond, (b) diamond with B–2Hcc configuration, (c) diamond with B–Hbc–Hcc configuration, and (d) diamond with B–2Hcc configuration. The dot line represents the Fermi level EF.