
Figures & data
Figure 1. The Skin Tone Rating Scale. Participants select the image that best represents their current skin tone and then the image that best represents their desired skin tone.
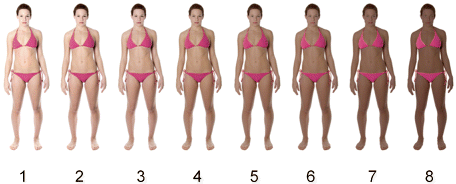
Table 1. Means (and standard deviations) for all variables measured among 156 Australian undergraduate women
Table 2. Correlations between skin tone dissatisfaction and the Physical Appearance Reasons for Tanning Scale (PARTS), internalisation of a tanned ideal, peer and media influence, and sun exposure
Table 3. Multiple mediation analyses (MMA) with unstandardised coefficients (and standard error (SE)), and estimates of direct and indirect pathways (with 95% confidence intervals (CI)), examining peer and media influence as a predictor of skin tone dissatisfaction, N = 145