
Figures & data
Figure 1. Working memory model (Baddeley, Citation2000). Reproduced with permission.
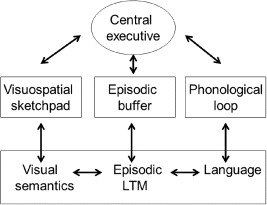
Table 1. Mean and standard deviations of the participants' characteristics
Figure 2. Example of a matrix in the static matrix span task. The critical lines are highlighted in bold in this figure. However, the lines to memorise were highlighted in red in the experiment.

Figure 3. Example of a response for the dynamic matrix span task. In each trial, participants saw a matrix wherein red lines appeared and disappeared, and they had to indicate the lines and order of appearance.
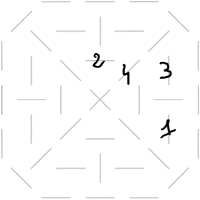
Table 2. Mean accuracy and standard deviations for musicians and non‐musicians on working memory tasks