
Figures & data
short-legendFigure 1. 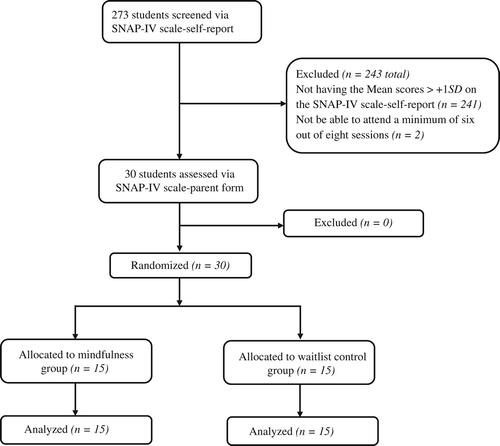
Table 1. Participant baseline characteristics for treatment (n = 15) and Waitlist (n = 15) groups
Table 2. Executive functioning post‐treatment comparisons between groups
Table 3. Within group pre‐test to post‐test comparisons for executive functioning
Table 4. Emotion dysregulation post‐treatment comparisons between groups
Table 5. Within group pre‐test to post‐test comparisons for emotion dysregulation