Figures & data
Table 1. Intercorrelations among study variables (N = 502)
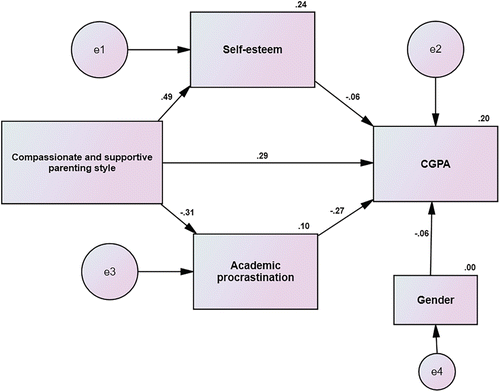
Table 2. Linear paths between study variables in the initial model
Table 3. Linear relationships between study variables in Model 2
Table 4. Model fit indices for the models emerged from the data (N = 502)
Table 5. Decomposition of path analysis (standardised effect)
Batool, S. S. (2016). Construction and validation of perceived dimensions of parenting scale (PDPS). Pakistan Journal of Social and Clinical Psychology, 14(2), 15–25. Rosenberg, M. (1965). Society and the adolescent self‐image. Princeton, NJ: Princeton University Press. Solomon, L. J., & Rothblum, E. D. (1984). Procrastination assessment scale for students (PASS). In J. Fischer & K. Corcoran (Eds.), Measures for clinical practice (pp. 446–452). New York: The Free Press. O'donovan, B., Price, M., & Rust, C. (2008). Developing student understanding of assessment standards: A nested hierarchy of approaches. Teaching in Higher Education, 13, 205–217. Bentler, P. M. (1990). Comparative fit indexes in structural models. Psychological Bulletin, 107, 238–246. Jöreskog, K. G., & Sörbom, D. (1984). LISREL‐VI user's guide (3rd ed.). Mooresville, IN: Scientific Software. Browne, M. W., & Cudeck, R. (1993). Alternative ways of assessing model fit. In K. A. Bollen & J. S. Long (Eds.), Testing structural equation models (pp. 136–162). Newbury Park, CA: Sage.